
Fig. 3
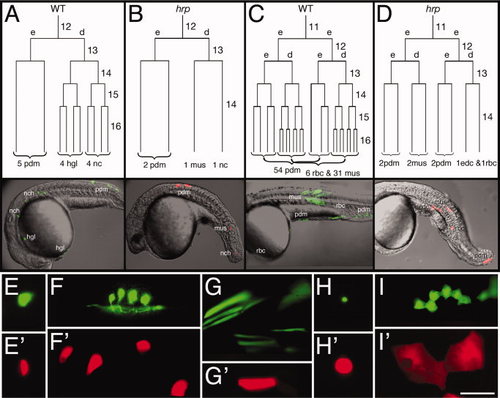
harpy mutant cells stop dividing at cell cycle 14. A–D: Dorsally derived fates (A,B), and ventrally derived fates (C,D). In each embryo, an individual blastomere was labeled at cycle 11 or 12 and followed by time-lapse video microscopy through early segmentation. Each is restricted to a deep cell lineage (d) or an EVL (e) lineage at the cycle after labeling. The reconstructed cell lineage is displayed by cell cycle. Twenty-four hour histotypes and cell counts for the clones are shown at the bottom of the lineage tree, and left side views of the 24 hr embryos are shown below. E–I: Comparison of different cell types at 24 hr. Whereas notochord cells (E) were normally sized in the mutants, neurons (F) and muscle cells (G) were larger, and blood cells (H) and periderm cells (I) were supersized. In our lineage studies we never saw axons sprouted from presumptive neurons in mutants. Wild-type cells, green; harpy mutant cells, red. edc, endothelial cell; hgl, hatching gland; mus, muscle; nc, notochord; pdm, periderm; rbc, red blood cell. Scale bar = 100 μm in E–I. |
| Fish: | |
|---|---|
| Observed In: | |
| Stage Range: | Shield to Prim-5 |