
FIGURE
Fig. S2
Fig. S2
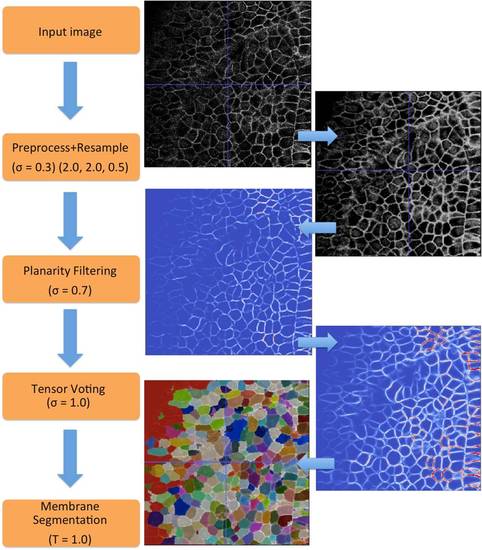
A flowchart of processing filters and parameters with intermediate outputs. There are four filters that take the input image to produce an output segmented image. For each step on the left, the corresponding input and output image is shown on the right. |
Expression Data
Expression Detail
Antibody Labeling
Phenotype Data
Phenotype Detail
Acknowledgments
This image is the copyrighted work of the attributed author or publisher, and
ZFIN has permission only to display this image to its users.
Additional permissions should be obtained from the applicable author or publisher of the image.
Full text @ PLoS Comput. Biol.