
Fig. 1
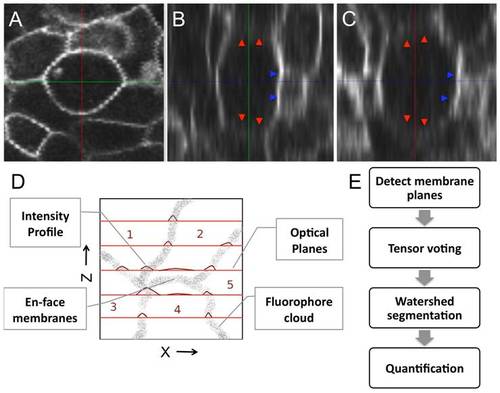
Reconstructing the membrane signal by eliminating intensity inhomogeneities. A single cell membrane is shown across (A), (B), and (C) sections. The plane shows a consistently bold and uniform membrane signal while the and views show a non-uniform membrane signal. Membrane planes en-face to the optical planes (marked by red arrows) are very weak and markedly diffuse in intensity. Membranes orthogonal to the imaging plane are sharper (blue arrows). (D) A qualitative model describing the formation of a membrane image under a fluorescent microscope. Flourophores tagged to membranes are shown as a point cloud (input). The focal planes are shown in red and the obtained intensity profiles on the plane are shown as plots. Cell membranes imaged oblique and en face such as the interface between cells are poorly visible in comparison to those orthogonal to the focal planes. (E) Three stages in the reconstruction process: (i) Detect membrane planes by mining for planar fluorophore distributions. This allows even weak membranes (en-face or oblique) to be extracted and accounts for intensity inhomogeneity. (ii) Voting to fill structural gaps or holes in the membrane signal that may not be contiguous. (iii) Region segmentation using the watershed algorithm to extract three-dimensional cell meshes for quantification. |