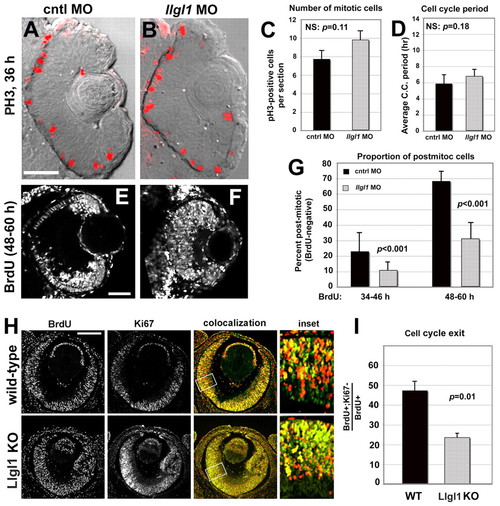
Loss of Llgl1 disrupts cell cycle exit in retinal progenitor cells. (A,B) Phosphohistone3 (PH3) immunoreactivity in zebrafish eyes of 36 hpf (A) wild-type and (B) llgl1 MO (8 ng) embryos. (C) Comparison of the number of PH3-positive mitotic cells between control (black bar) and llgl1 morphant (gray bar) zebrafish embryos (n=12 eyes analyzed for each condition). (D) Comparison of the cell cycle period between control (black bar) and llgl1 morphant (gray bar) zebrafish embryos (n=25 cells each from four control MO or five llgl1 MO embryos). (E,F) Retinal sections from 60 hpf wild-type (E) or llgl1 morphant (F) zebrafish showing BrdU labeling starting at 48 hpf. (G) Comparison of the proportion of BrdU-negative (post-mitotic cells) per section between control (black bars) and llgl1 morphant (gray bars) zebrafish embryos (n=10 retina analyzed for each condition). BrdU was injected from 34-46 hpf (left) or from 48-60 hpf (right). (H) BrdU labeling [red (E14.5-E15.5)] and Ki67 (green) immunoreactivity with colocalization (yellow) and high-magnification inset for wild-type and Llgl1 homozygous mutant mice. (I) Comparison between wild-type (black bar) and Llgl1 homozygous mutant mice (gray bar) for the percentage of retinal cells that had exited the cell cycle between E14.5 and E15.5 (proportion of BrdU-positive; Ki67-negative of the total number of BrdU-positive cells). For each genotype, six eyes from three embryos were quantified. For C,D,G,I, error bars represent s.e.m.; P, Student’s t-test; NS, not significant. Scale bars: 100 μm in A,B,H; 50 μm in E,F.
|
