
Fig. S1
- ID
- ZDB-FIG-120201-45
- Publication
- Tao et al., 2011 - Zebrafish prox1b Mutants Develop a Lymphatic Vasculature, and prox1b Does Not Specifically Mark Lymphatic Endothelial Cells
- Other Figures
- All Figure Page
- Back to All Figure Page
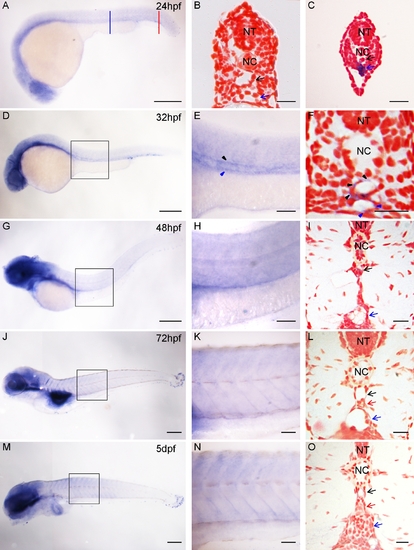
Prox1b transcript expression in zebrafish. (A–O) shows prox1b expression analyzed by in situ hybridization in whole mount embryos (A, D, E, G, H, J, K, M and N) and transverse sections (B, C, F, I, L, and O), at different stages: 24 hpf (A–C), 32 hpf (D–F), 48 hpf (G–I), 72 hpf (J–L) and 5 dpf (M–O). (E), (H), (K) and (N) individually show the enlarged views of the boxed area in (D), (G), (J) and (M). The blue and red bars in (A) represent the positions of the sections in (B) and (C). prox1b expression is prominent in the caudal vein of embryos at 24 hpf (C) and in both the DA and PCV at 32 hpf stage, shown by (E) and (F). (G–O) However, there is no signal in the blood and lymphatic endothelial cells of older embryos at 48 hpf, 72 hpf and 5 dpf. The black arrows point to the dorsal aorta; the blue arrows point to the posterior cardinal vein or caudal vein; and the red arrows point to thoracic duct. The black and blue arrow heads point to the prox1b expression in the DA and PCV separately. NT: neural tube; NC: notochord. Scale bars represent 200 μm in (A), (D), (G), (J), (M); 50 μm in (E), (H), (K) and (N); and 20 μm in (B), (C), (F), (I), (L) and (O). |
| Gene: | |
|---|---|
| Fish: | |
| Anatomical Terms: | |
| Stage Range: | Prim-5 to Day 5 |