
Fig. 3
- ID
- ZDB-FIG-120201-41
- Publication
- Tao et al., 2011 - Zebrafish prox1b Mutants Develop a Lymphatic Vasculature, and prox1b Does Not Specifically Mark Lymphatic Endothelial Cells
- Other Figures
- All Figure Page
- Back to All Figure Page
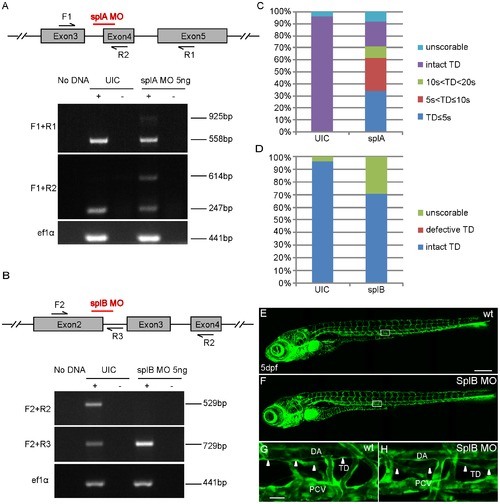
Morpholino-mediated knock-down of prox1b does not cause lymphatic phenotypes. (A) and (B) show schematics of the prox1b genomic locus with the red bars indicating target sites of the respective splice morpholinos. The numbered black arrows show the position of the primers used in RT-PCRs for examining the splicing of prox1b transcripts. (A) RT-PCR to detect splicing of prox1b in un-injected (UIC) and splA MO injected embryos. The expression of elongation factor 1-alpha (ef1a) gene represents the loading control. Primer pair F1 and R1 amplifies wild-type transcript band (558 bp) and incorrectly spliced transcripts (925 bp), which fail to excise the intron3-4 (367 bp). Primer pair F1 and R2 amplifies wild-type transcript (247 bp) and non-spliced transcripts (614 bp), which retain intron3-4. (B) RT-PCR to detect splicing of prox1b in un-injected and embryos injected with splB MO. Primer pair F2 and R2 amplifies wild-type transcripts (529 bp), which are missing in splB MO injected embryos. Primer pair F2 and R3 amplifies non-spliced transcripts (729 bp), which preferentially accumulated in morphant embryos. (C) Histograms showing the percentage of fli1:GFP embryos with different lengths of TD (10 s<TD<20 s means the partial TD covers the length of 10 to 20 somites in the trunk). Up to 70% of splA MO injected embryos displayed complete or partial loss of TD, even though splA MO seems not to affect prox1b splicing efficiently. Embryos were scored at 5 dpf. (D) Histograms showing the percentage of fli1:GFP embryos with intact or defective TD, and all the scorable embryos (their overall morphology was all right and they had normal blood circulation and did not develop edema at 5 dpf) developed complete TD after injection with splB MO. (E) and (F) show the full images of 5-day UIC (E) and splB MO injected embryos (F). (G) and (H) show enlarged views of the boxed areas in (E) and (F). The white arrowheads indicate the presence of TD in both control embryos (G) and morphants (H). Scale bars represent 250 μm in (E), and 25 μm in (G). |
| Fish: | |
|---|---|
| Knockdown Reagents: | |
| Observed In: | |
| Stage: | Day 5 |