
Fig. 9
- ID
- ZDB-FIG-110712-19
- Publication
- Chapouton et al., 2011 - Expression of Hairy/enhancer of split genes in neural progenitors and neurogenesis domains of the adult zebrafish brain
- Other Figures
- All Figure Page
- Back to All Figure Page
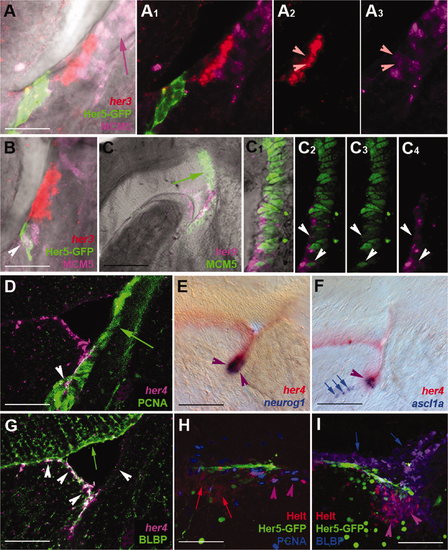
her Gene expression in the adult posterior midbrain in both quiescent progenitors and the actively neurogenic IPZ. her Gene expression was detected by in situ hybridization (A–G) or immunocytochemistry (Her5-GFP in A,B,H,I; Helt in H,I) on 80-μm vibratome cross-sections at levels equivalent to Figure 8P. A–D: Expression of her3 (A,B, red), her4 (D, magenta), Her5-GFP (A,B, green), and her9 (C–C4, magenta) compared with the proliferation markers MCM5 (A,B, purple; C–C4, green) or PCNA (D; green) and analyzed under confocal microscopy demonstrates the near exclusion of her transcripts from dividing cells (see purple and green arrows in A,C). In the ventralmost aspect of the IPZ, however, a few proliferating, her-positive cells can be seen (arrowheads in A–D). Single channels, as well as a magenta-green version, corresponding to A and B are illustrated again in Supporting Information Figure 1. E,F: Comparison of the expression of her4 (red) with the proneural markers neurog1 and ascl1a (blue). Note the very distinct expression of proneural genes at the ventral IPZ tip in the domain coexpressing her genes (purple arrowheads). Blue arrows in F point to neuroblasts apparently delaminating from this domain. G: Comparison of her4 (red) and BLBP (green) expression analyzed using confocal microscopy demonstrates expression of BLBP by all (or most) her4-positive cells. The section is the same as in D. Note the absence of her4 transcripts in radial glia lining the optic tectum (green arrow) and the nonglial nature of the IPZ (white arrowhead). H,I: Comparison of the expression of Helt (red) with Her5-GFP (green) and PCNA or BLBP (blue in H,I, respectively) on sagittal sections of the IPZ (same orientation as in Fig.8H). Note the adjacent location of Helt- and Her5-expressing cells and the coexpression of PCNA by a few Helt-positive cells only (purple arrowheads in H), although most of the Helt domain is nonproliferating (red arrows in H) and BLBP-positive (purple arrowheads in I). The blue arrows in I point to the BLBP-positive, Helt-negative domain lining the optic tectum ventricle. Scale bars = 20 μm in A,B; 50 μm in C,D,G–I; 100 μm in E,F. |
| Genes: | |
|---|---|
| Antibody: | |
| Fish: | |
| Anatomical Term: | |
| Stage: | Adult |