
Fig. 3
- ID
- ZDB-FIG-110712-15
- Publication
- Chapouton et al., 2011 - Expression of Hairy/enhancer of split genes in neural progenitors and neurogenesis domains of the adult zebrafish brain
- Other Figures
- All Figure Page
- Back to All Figure Page
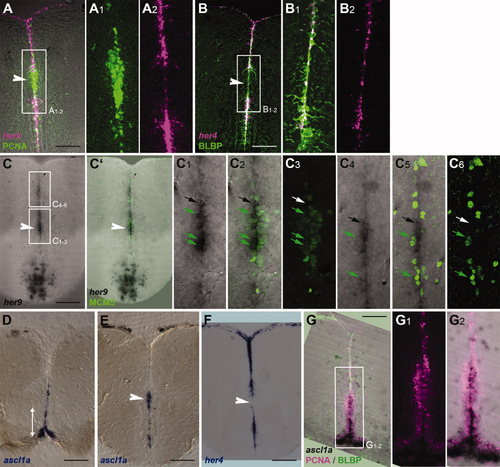
Compared expression of her4 and her9 genes in the adult telencephalon with radial glia and actively dividing neurogenic domains. her Gene expression was detected by in situ hybridization on 80-μm vibratome cross-sections at levels as depicted in Figure 2A (for D,G) or Figure 2G (all other panels). A–C6 and G–G2 are confocal views. The white double arrow in D indicates the approximate extent of the RMS-like stripe at this very anterior level; in other panels, the white arrowhead points to the position of the RMS. A–B2: Expression of her4 (magenta) compared with the proliferation marker PCNA (A–A2) or the radial glia marker BLBP (B–B2; immunocytochemistry, green) by using confocal microscopy demonstrates the exclusion of her4 transcripts from dividing cells and their expression in radial glia. A1 and A2 are single-channel views of the area boxed in A. C–C6: Expression of her9 (black) compared with the proliferation marker MCM5 (green) demonstrates prominent her9 expression within the RMS-like domain. C2 is the same section as in C showing the overlay of the her9 and MCM5 stainings. C1–6 are high magnifications of the areas boxed in C. Within the RMS, numerous cells coexpressing her9 and MCM5 can be seen (green arrows; C1–3), although cells expressing her9 but negative for MCM5 are also visible (black arrow). In more dorsal ventricular locations (C4–6), her9 expression is decreased as well as the proportion of MCM5-positive cells within the her9-positive population. D,E: Expression of ascl1a (blue) revealed by in situ hybridization at levels shown in Figure 2A and G, respectively. Note the prominent expression of ascl1a within the RMS. F: Expression of her4 at the same level as section E shows that the her4 and ascl1a domains are essentially complementary. G–G2: Compared expression of ascl1a (in situ hybridization, black), PCNA (magenta), and BLBP (green) at anterior telencephalic levels. G1 and G2 are high magnifications of the area boxed in G depicting PCNA only (G1) or the merged PCNA and ascl1a patterns (G2). Note that ascl1a expression is strongest within the RMS. Scale bars = 100 μm. |
| Genes: | |
|---|---|
| Fish: | |
| Anatomical Terms: | |
| Stage: | Adult |