
Fig. S3
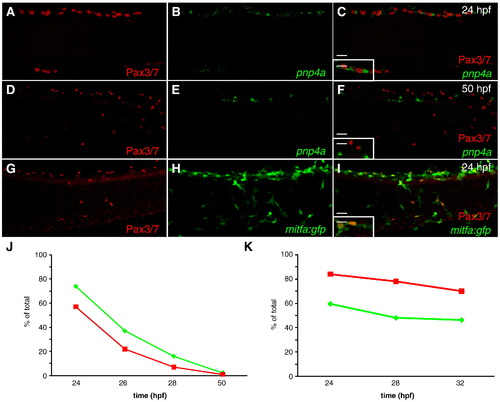
Xanthoblast marker Pax3/7 expression overlaps with iridoblast and melanoblast marker. (A–I) Confocal images collected from lateral aspect of anterior tail region of fixed zebrafish, 20x. (A–C,J) Wild-type embryo reveals that Pax3/7+ cells overlap with pnp1 expression at 24 hpf then resolve at 50 hpf (D–F). (A,D) Pax3/7 (B,E) pnp1. (C,F) Color merged: red: Pax3/7 antibody, green: pnp1 mRNA (inset 40x). (G–I) Wild-type embryo reveals Pax3/7 signal strongly localized with mitfa:gfp expression at 24 hpf (G) Pax3/7 (H) mitfa:gfp. (I) Color merged: green: mitfa:gfp, red: Pax3/7 (inset 40x). (J,K) Line graphs depicting percent of overlap between chromatoblast markers (see Table S1 in supplementary material). (J) Red line = % of Pax3/7+ cells that are pnp4a+/Pax3/7+. Green line = % of pnp4a+ cells that are pnp4a+/Pax3/7+. (K) Red line = % of Pax3/7+ cells that are mitfa:gfp+/Pax3/7+. Green line = % of mitfa:gfp+ cells that are mitfa:gfp+/Pax3/7+. Scale bars: (A–I) 20 μm; (C,F,I inset) 10 μm. |
| Genes: | |
|---|---|
| Antibody: | |
| Fish: | |
| Anatomical Term: | |
| Stage: | Prim-5 |
Reprinted from Developmental Biology, 344(1), Curran, K., Lister, J.A., Kunkel, G.R., Prendergast, A., Parichy, D.M., and Raible, D.W., Interplay between Foxd3 and Mitf regulates cell fate plasticity in the zebrafish neural crest, 107-118, Copyright (2010) with permission from Elsevier. Full text @ Dev. Biol.