
FIGURE
Fig. 4
Fig. 4
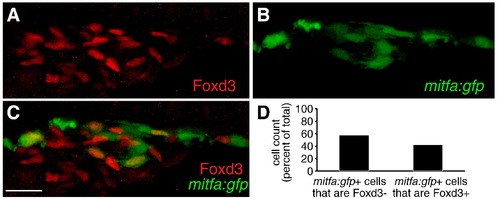
mitfa positive neural crest cells re-acquire Foxd3 expression. (A–C) Confocal images taken from lateral aspect of anterior trunk, 40x. (A) Foxd3, (B) mitfa:gfp, (C) merged: red channel: Foxd3, green channel: mitfa:gfp. (D) Cell counts of mitfa:gfp positive cells that are either Foxd3 positive or negative, counts derived from 40x confocal images at 24 hpf, numbers given as percent of total. 52% of mitfa:gfp+ cells are Foxd3- (432/748). 48% of mitfa:gfp+ cells are Foxd3+ (316/748). Scale bar = 30 μm. |
Expression Data
| Genes: | |
|---|---|
| Fish: | |
| Anatomical Term: | |
| Stage: | Prim-5 |
Expression Detail
Antibody Labeling
Phenotype Data
Phenotype Detail
Acknowledgments
This image is the copyrighted work of the attributed author or publisher, and
ZFIN has permission only to display this image to its users.
Additional permissions should be obtained from the applicable author or publisher of the image.
Reprinted from Developmental Biology, 344(1), Curran, K., Lister, J.A., Kunkel, G.R., Prendergast, A., Parichy, D.M., and Raible, D.W., Interplay between Foxd3 and Mitf regulates cell fate plasticity in the zebrafish neural crest, 107-118, Copyright (2010) with permission from Elsevier. Full text @ Dev. Biol.