
Fig. S2
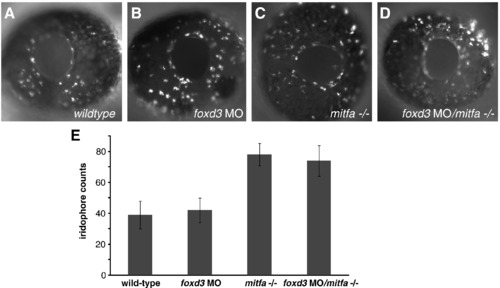
Foxd3 fails to repress eye iridophores. (A–D) Incident light reveals iridophores on eyes of 48 hpf zebrafish, lateral view, 10x. (A) Wild-type zebrafish eye displays normal numbers of eye iridophores. (B) Foxd3 morphant displays normal number of eye iridophores. (C) mitfa-/- eye displays supernumerary iridophores. (D) foxd3MO/mitfa mutant eye exhibits supernumerary iridophores. (E) Eye iridophore cell counts collected from 20 zebrafish for each genetic background. Mean iridophore cell counts: (wild-type: 39), (foxd3 MO: 42), (mitfa/-: 78), and (foxd3 MO/mitfa-/-: 74). Bars = s.d. For an internal control, trunk iridophores were counted along the dorsal and ventral stripes from the posterior tail region, between the cloacae and tail tip at 72 hpf. Mean trunk iridophore cell counts: (wild-type: 28), (foxd3 MO: 16), (mitfa-/-: 48), and (foxd3 MO/mitfa-/-: 38). Trunk iridophore standard deviation: (wild-type: ±5), (foxd3 MO: ±5), (mitfa-/-: ±4), and (foxd3 MO/mitfa-/- double mutant: ±4). |
| Fish: | |
|---|---|
| Knockdown Reagent: | |
| Observed In: | |
| Stage: | Long-pec |
Reprinted from Developmental Biology, 344(1), Curran, K., Lister, J.A., Kunkel, G.R., Prendergast, A., Parichy, D.M., and Raible, D.W., Interplay between Foxd3 and Mitf regulates cell fate plasticity in the zebrafish neural crest, 107-118, Copyright (2010) with permission from Elsevier. Full text @ Dev. Biol.