
Fig. 7
- ID
- ZDB-FIG-091214-23
- Publication
- Picker et al., 2009 - Dynamic coupling of pattern formation and morphogenesis in the developing vertebrate retina
- Other Figures
- All Figure Page
- Back to All Figure Page
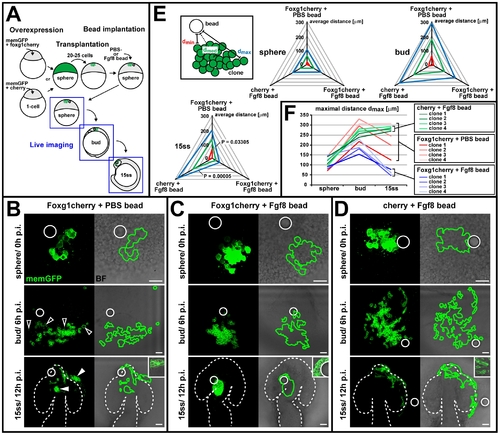
Foxg1 mediates cell cohesion in an Fgf-dependent manner. (A) Schematic of the overexpression-cell-transplantation-bead-implantation assay to test for an Fgf-dependent effect of foxg1 on cell cohesion by monitoring lateral cell spreading in live embryos. (B–D) Live images of horizontal cell spreading at sphere (0 h postimplantation [p.i.], top), bud (6 h postimplantation, middle), and 15ss (12 h postimplantation, bottom) from a representative clone overexpressing foxg1cherry in the presence of a PBS control bead (B), a clone overexpressing foxg1cherry in the presence of an Fgf8 bead (C), and a clone overexpressing cherry in the presence of an Fgf8 bead (D). Left: memGFP image (confocal z-projection), right: clone outline (green line), derived from memGFP image, superimposed with a bright-field (BF) image, showing bead localization (white circle). Dotted outlines: neural tube border. Insets in lower panels show cell morphology (bright-field image superimposed with a single confocal section of memGFP). Open arrowheads in (B): abnormal cells not included in tracking the clone outline. White arrowheads in (B): autonomous clustering of foxg1-overexpressing cells in the olfactory placode, head mesenchyme, and telencephalon. Scale bar: 50 μm. (E) Quantification of lateral cell spreading relative to the site of bead implantation. The maximal cell distance (dmax, blue) and the minimal distance from the bead surface (dmin, red) was measured (on projected z-stacks) and the median distance (dmed, green) calculated on the basis of dmax and dmin for four representative clones at sphere, bud, and 15ss. Radial plots of average dmax, dmin, and dmed values (in micrometers) at sphere, bud, and 15ss, (n = 4/stage) for foxg1cherry overexpression in the presence of a PBS control bead (top axis), foxg1cherry overexpression in the presence of an Fgf8 bead (right axis), and cherry overexpression in the presence of an Fgf8 bead (left axis). p-Values for 15ss stage derived by a paired, two-tailed t-test. (F) Line plots of single dmax values (in micrometers) over time (sphere, bud, 15ss) for four representative clones overexpressing foxg1cherry in the presence of a PBS control bead (red), overexpressing foxg1cherry in the presence of a Fgf8 bead (blue), and overexpressing cherry in the presence of a Fgf8 bead (green). Brackets indicate dmax value range at 15ss. |