
Fig. 4
- ID
- ZDB-FIG-091214-20
- Publication
- Picker et al., 2009 - Dynamic coupling of pattern formation and morphogenesis in the developing vertebrate retina
- Other Figures
- All Figure Page
- Back to All Figure Page
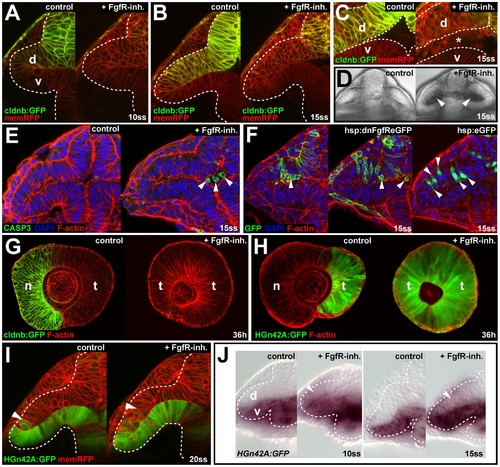
Fgf signaling is required for epithelial integrity of nasal retina progenitors. (A–D) Live images of wt control (left) and FgfR-inh.-treated embryos (right). Tg(-8.0cldnb:lynGFP)zf106 (green) and memRFP colabel (red) at 10ss, 2 h after treatment (hpt) (A), at 15ss, 4 h hpt at low magnification (B), high magnification (C), and in bright field (D) (asterisk in [C] and arrowheads in [D]: delaminated cells in the optic vesicle ventricle). (E) Apoptosis detection with anti-CASP3 (green), counterstained for cortical F-actin (red) and DAPI (blue) in wt control (left) and FgfR-inh.-treated embryo (right) at 15ss, 4 hpt (arrowheads: delaminated cells in the optic vesicle ventricle). (F) Single cells in Tg(hsp70l:dnfgfr1-EGFP)pd1 clones (left two panels) aggregate (left) and protrude apically and are found in the ventricle (middle) at 15ss, 5 h after heat shock, compared to identically treated hsp70l:eGFP control clones (right). Counterstaining: F-actin (red), DAPI (blue). (G) cldnb:GFP expression (green), counterstained for F-actin (red) in the nasal retina of control (left) is absent after FgfR-inh. treatment (right) at 36 h (single, longitudinal confocal sections with nasal to the left). (H) HGn42A:GFP expression (green), counterstained for F-actin (red) in the temporal retina of control (left) is expanded throughout the retina after FgfR-inh. treatment (right) at 36 h (single, longitudinal confocal sections with nasal to the left). (I) Live images of HGn42A:GFP expression (green) in wt control (left) and FgfR-inh.-treated embryos (right) at 20ss, colabeled with membrane-targeted RFP (red) (arrowheads: distal GFP expression limit). (J) HGn42A:GFP transcription detected by GFP in situ hybridization at 10- (left) and 15ss (right) in the ventral optic vesicle leaflet of control embryos is expanded into the dorsal optic vesicle leaflet upon FgfR-inh. treatment (white arrowheads). Orientation in (A–F, I, and J): cross-sections through one half of the forebrain, dorsal to the top and lateral to the left, in (G and H): lateral with nasal/anterior to the left and dorsal to the top. Dotted lines: neural tube boundary. d, dorsal optic vesicle leaflet; n, nasal; t, temporal; v, ventral optic vesicle leaflet. |
| Fish: | |
|---|---|
| Condition: | |
| Observed In: | |
| Stage: | 14-19 somites |