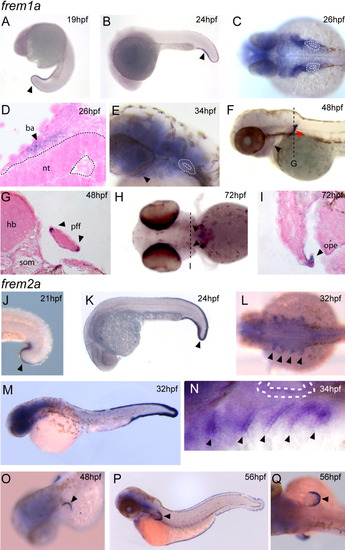
Expression of frem1a and frem2a during development. Expression of frem1a (A-I) and frem2a (J-Q). A,B: Lateral views of frem1a expression detail expression of the gene in the developing caudal fin fold (arrowhead). C-E: At later stages the gene is also expressed in the developing branchial arches (C and D, in section; E, lateral view with hyoid indicated (arrowhead); otic vesicle highlighted in C and E). F-I: Expression is noted in the pectoral fins (F, lateral red arrowhead; G in section) and posterior ectodermal margin (PEM) of the hyoid arch (F and H, ventral, arrowhead) and in section (I, arrowhead). The line in H is the plane of section in I. J,K: Like frem1a, frem2a is expressed in the differentiating caudal fin fold (J and K, lateral views, arrowhead). L-N: Expression in the brachial arches initiates at 24 hours postfertilization (hpf) and by 32 hpf becomes strongest in the endodermal pouches (arrowheads in L, dorsal; in M, N dorsolateral, otic vesicle highlighted). O-Q: Expression is also detected in the pectoral fin folds (O-Q, arrowheads) and persists in the caudal fin folds of older fish (P, Q). ba, branchial arch; hb, hindbrain; som, somites; pff, pectoral fin fold; ope, operculum.
|
