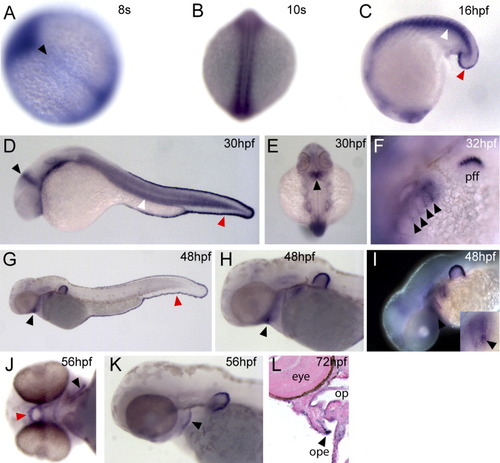
A: Expression of fras1 during development. fras1 expression is first noted in the axial midline 8 hr postfertilization (A, arrowhead). B-D: Transcripts are then detected in the developing somites (B, dorsal; C and D, white arrowheads). D,E: Expression is noted in the midbrain-hindbrain boundary (D, black arrowhead) toward the medial aspect of the future cerebellum (E, arrowhead). F: Transcripts are detected in the branchial arches specifically in the differentiating endodermal pouches (arrowheads). C,D,G: Strong expression is noted in the caudal fin fold shortly after its differentiation at the early tail bud stage (red arrowheads). F-I,K: Expression is detected in the pectoral fin fold (F) and this persists throughout the period investigated (G-I,K). G,H: By 48 hpf expression is noted in the oral ectoderm (black arrowheads) and in the posterior margin of the hyoid arch. I: By this stage, expression in the branchial arches is strongest in the pouches 4 and 5, in the most ventral aspects of these structures (inset arrowhead). J-L: Expression in the oral ectoderm persists at 56 hpf (J, red arrowhead) as does expression in the posterior ectodermal margin (PEM) at 56 hpf (J and K, black arrowheads) and 72 hpf (L, section, arrowhead). op, oropharynx; ope, operculum.
|
