|
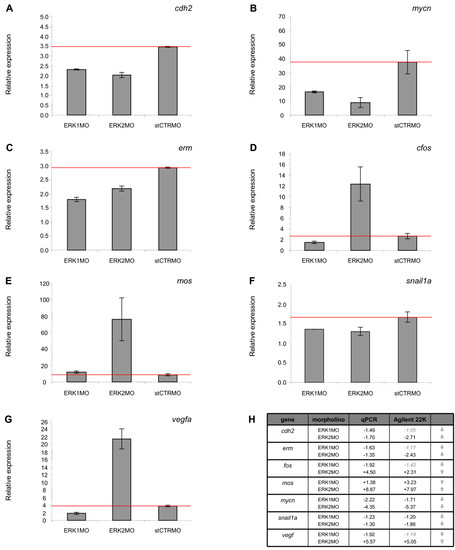
Quantitative real-time PCR confirmation of the microarray results. (A-G) qPCR was performed on seven genes that showed differential regulation of expression in response to knockdown of either ERK1, ERK2 and the standard control MO control:cdh2 (NM_131081), mycn (NM_212614), erm (NM_131205), cfos (NM_205569), mos (NM_205580), snai1a (NM_131066) and vegf (NM_131408), correlated to the β-actin housekeeping gene. A comparison of the fold changes in expression of these genes, detected by qPRC assay and microarray, are listed in a table (H). ⇑ = induction of expression, ⇓ = repression of expression, compared to the standard control MO (A-C, red line).
|