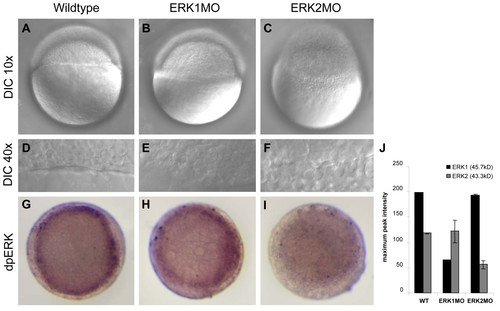
Phenotype and Function analysis of morpholino mediated knockdown of ERK1 and ERK2. Differential interference contrast (DIC) microscopy of 4.5 h old embryos using a 10x objective (A,B,C,) or an enlargement of the margin, using a 40x objective (D,E,F) Wild type (Wt) and ERK1 morphants are at approximately 30% epiboly stage and undergo epiboly, whereas ERK2 morphants do not initiate epiboly. Localization of active ERK (dpERK) was detected by immuno-localization in wild type, ERK1MO and ERK2MO injected embryos at 4.5 hpf (G-I) by phospho-specific ERK antibody. The level of dpERK was lower in ERK1 morphants compared to wild type embryos, whereas ERK2 morphants hardly showed any active ERK staining, (A-C); lateral view, animal pole to top, (G-I); animal pole view, dorsal to right. The bar graphs in (J) represent the quantification of a western blot analysis of zebrafish wild type, ERK1MO and ERK2MO injected embryos, probes with a global ERK1 antibody (Santacruz). This antibody recognizes both zebrafish ERK1 (45.7 kD) and ERK2 (43.3 kD) protein. The bars represent the maximum pixel-intensity measured in duplo and clearly show the specific knockdown of either ERK1 or ERK2 by the corresponding morpholino.
|
