
Fig. S1
- ID
- ZDB-FIG-080829-53
- Publication
- Kishi et al., 2008 - The identification of zebrafish mutants showing alterations in senescence-associated biomarkers
- Other Figures
- All Figure Page
- Back to All Figure Page
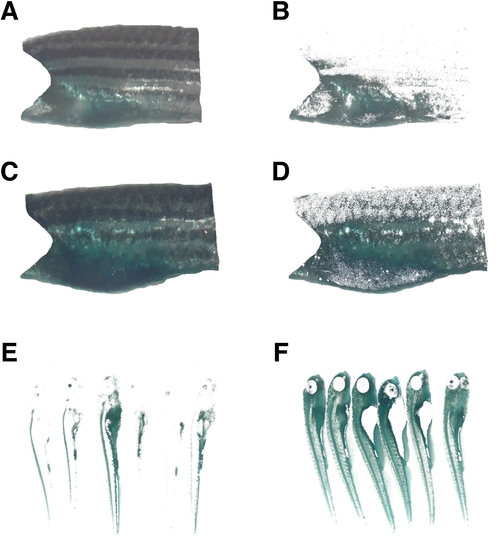
Pixel images for quantitation of SA-β-gal activity in zebrafish. (A–D) Colorimetric quantitation of SA-β-gal activity staining in the trunk sections of adult zebrafish. Lateral photographs were taken, and the area between the operculum and the dorsal and anal fins was chosen for quantitation (A and B). The blue pixel area was calculated (C and D as described in Materials and Methods), and SA-β-gal activity is expressed as a percentage of the total area values. The analysis was performed on both sides of each fish. Shown here are fish aged 5 months (A and C) and 57 months (B and D). E and F: Colorimetric quantitation of SA-β-gal activity in zebrafish embryos. The total blue pixel number was determined from lateral photographs of individual 3.5-day old zebrafish embryos. SA-β-gal staining intensities were quantified in untreated embryos (E) and embryos incubated in 500 mM BHP (F). |