|
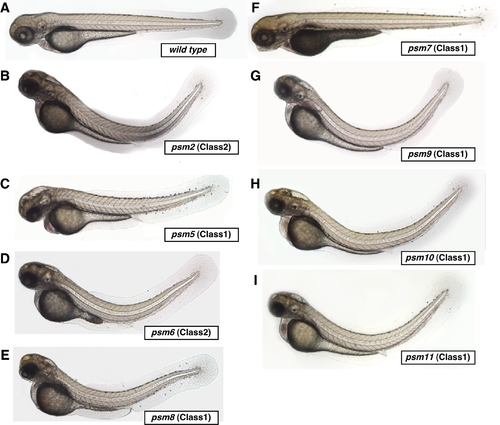
Homozygous psm mutant zebrafish embryos and their respective classes.
Shown are a wild type embryo (A), and psm2 (B), psm5 (C), psm6 (D), psm8 (E), psm7 (F), psm9 (G), psm10 (H), and psm11 (I) mutant embryos (with PTU). Neurodegenerative mutants (psm2, 5, 6, 8, 9, 10, 11) have opaque regions in the head and obvious dorsal curvature by 3.5 dpf as homozygotes. The homozygous muscle atrophy mutant psm7 is accompanied by an opaque yolk and a slightly protruding jaw. Class 1 mutants (psm5, 7, 8, 9, 10 and 11) were revealed by our oxidative stress CASH screen as candidates that displayed high SA-β-gal activity in heterozygotes when stressed with 350 μM BHP from 6 hpf to 6 dpf. Class 2 mutants (psm2 and 6) showed obvious SA-β-gal activity, but morphologically abnormal phenotypes in heterozygotes when stressed with 350 μM BHP from 6 hpf to 6 dpf in the CASH screen.
|