FIGURE

Fig. 5

ID
ZDB-FIG-080829-49
Publication
Kishi et al., 2008 - The identification of zebrafish mutants showing alterations in senescence-associated biomarkers
Other Figures
All Figure Page
Back to All Figure Page
Fig. 5

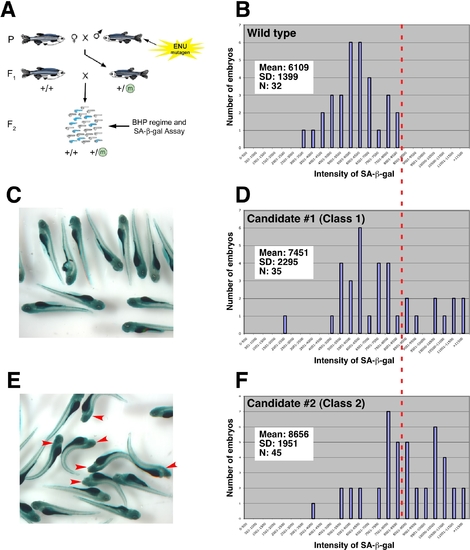
CASH screening methodology and mutant candidate identification.
(A) Schematic representation of mutagenized wild-type male zebrafish bred with wild-type females. Males from the resultant F1 generation are raised and outcrossed with wild-type females. The resultant embryo clutches will be 50% wild type and 50% heterozygous with respect to a mutation generated in the parental (P) gametes. These F2 embryos are treated with moderate levels of BHP and stained for SA-β-gal activity (C). Quantitation of the staining levels is then performed. Embryo counts are grouped into 500-pixel intensity cohorts and plotted. (B) Wild-type embryos show a tight Gaussian distribution of staining intensity. Significantly right-shifted distributions (dotted red line in D) identify Class 1 candidates in terms of their oxidative stress sensitivity (D). Class 2 mutant candidates are identified if direct phenotypic abnormalities (red arrows) exist in approximately 50% of the embryos of clutches only in the presence of exogenous oxidative stress (an example is shown in E and F), with significantly right-shifted distributions (dotted red line in F).

Expression Data

Expression Detail
Antibody Labeling
Phenotype Data

Phenotype Detail
Acknowledgments
This image is the copyrighted work of the attributed author or publisher, and ZFIN has permission only to display this image to its users. Additional permissions should be obtained from the applicable author or publisher of the image. Full text @ PLoS Genet.