
Fig. 1
- ID
- ZDB-FIG-050729-3
- Publication
- Xiao et al., 2005 - A GFP-based genetic screen reveals mutations that disrupt the architecture of the zebrafish retinotectal projection
- Other Figures
- All Figure Page
- Back to All Figure Page
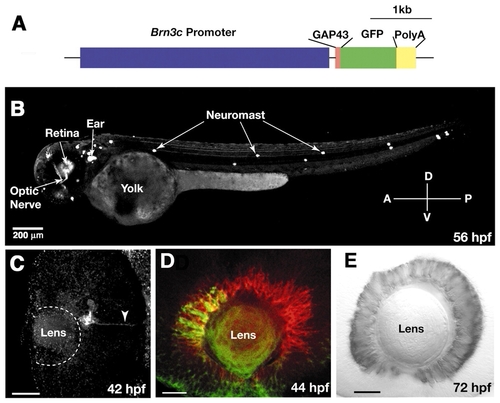
A large subset of RGCs express GFP in the stable Brn3c:mGFP transgenic line. (A) Schematic drawing of the DNA construct used to generate the Brn3c:mGFP transgenic line. (B) Lateral view of 56 hpf live Brn3c:mGFP transgenic embryo showing GFP expression by RGCs and mechanosensory hair cells (neuromasts) of the lateral line and inner ear. The optic nerve is visible. (C-E) Fixed Brn3c:mGFP transgenic embryos labeled by whole-mount immunohistochemistry. (C) Ventral view of a 42 hpf retina, labeled with anti-GFP. Anterior (nasal) is upwards. GFP expression starts in a small cluster of cells in the ventronasal retina, near the optic fissure. The arrowhead indicates the first GFP-positive axons exiting the eye through the optic stalk. (D) Lateral view of a 44 hpf retina, labeled with anti-GFP in green and zn5 in red. GFP has spread into central retina. The onset of Brn3c:mGFP transgene expression follows that of zn5 by 6 hours. (E) Lateral view of a 72 hpf retina, labeled with anti-GFP. GFP-positive RGCs are distributed uniformly throughout the ganglion cell layer. Scale bars: 200 µm in B; 20 µm in C-E.
|