
- Title
-
Ginsenoside Re promotes osteogenic differentiation via BMP2/p38 pathway in vivo and in vitro
- Authors
- Wang, Y., Zhang, G., Deng, L., Zhang, H., Alonge, E., Jiang, Z.
- Source
- Full text @ J Ginseng Res
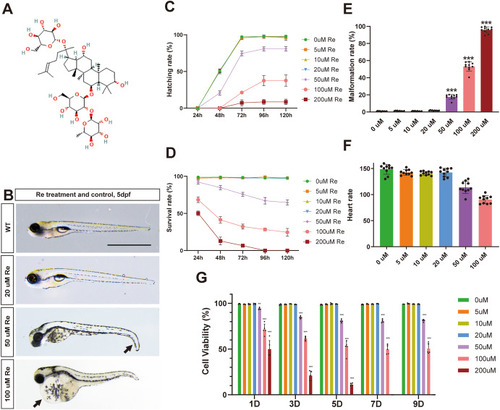
Zebrafish larvae's growth and development, as well as the viability of the MEC3T3-E1 cell line, remained unaffected by 20 μM Ginsenoside Re. A. The chemical formula of Ginsenoside Re. B. The impacts of Ginsenoside Re on the development of zebrafish larvae on 5-day post fertilization (dpf)(n = 10). C-D. The hatching rate and survival rate of zebrafish larvae were assessed over a time span ranging from 24 to 120 h, during exposure to different concentrations of a substance referred to as Ginsenoside Re(n = 10). E-F. Zebrafish larvae were exposed to various concentrations of Ginsenoside Re, and the malformation rates and heart rates were recorded at 3 dpf (n = 10). G. The cell viability of the MEC3T3-E1 cell line was assessed over a period ranging from 1 day to 9 days, during exposure to different concentrations of a substance referred to as Ginsenoside Re (n = 5). Statistical methods: two-tailed Student's t-test, (∗P < 0.05, ∗∗P < 0.01, ∗∗∗P < 0.001). |
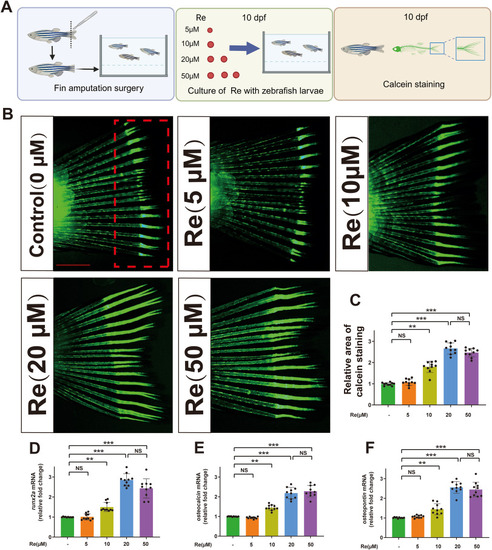
Ginsenoside Re promotes bone formation ability during fin regeneration in the zebrafish fin amputation surgery model. A. Schematic representation of the assessment of the effect of Ginsenoside Re on tail fin regeneration in the zebrafish tail fin amputation model using calcein staining. B. Results of calcein staining in zebrafish tail amputation model treated with different concentrations of Ginsenoside Re for 10 days. C. Histogram results of calcein staining of zebrafish treatment with Ginsenoside Re at 0–50 μM. D-F. The relative expression of mRNAs for runx2a, osteocalcin and osteopontin in Zebrafish under treatment with various concentrations of Ginsenoside Re. Statistical methods: two-tailed Student's t-test, (∗P < 0.05, ∗∗P < 0.01, ∗∗∗P < 0.001). |
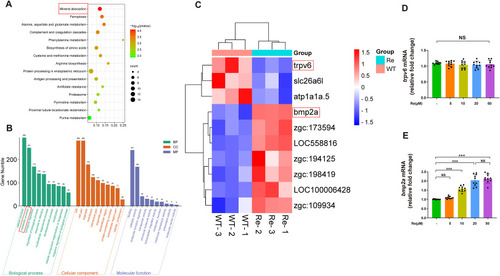
The mRNA sequencing analysis suggests bmp2a as a promising candidate as a key regulator of bone formation in zebrafish treated with Ginsenoside Re. A. Significant differences in mineralization metabolic pathways revealed by KEGG pathway enrichment analysis in zebrafish treated with Ginsenoside Re. B. Differential gene GO classification analysis indicates predominance of metabolic processes among differentially expressed genes in zebrafish treated with Ginsenoside Re. C. Differential gene clustering Heat Map reveals trpv6 and bmp2a genes as potential candidates for Ginsenoside Re-mediated osteogenesis promotion in zebrafish tail fin amputation model. D. Ginsenoside Re induces downregulation of trpv6 gene expression in the zebrafish tail fin regeneration model. E. Ginsenoside Re induces upregulation of bmp2a gene expression in the zebrafish tail fin regeneration model. Statistical methods: two-tailed Student's t-test, (∗P < 0.05, ∗∗P < 0.01, ∗∗∗P < 0.001). |
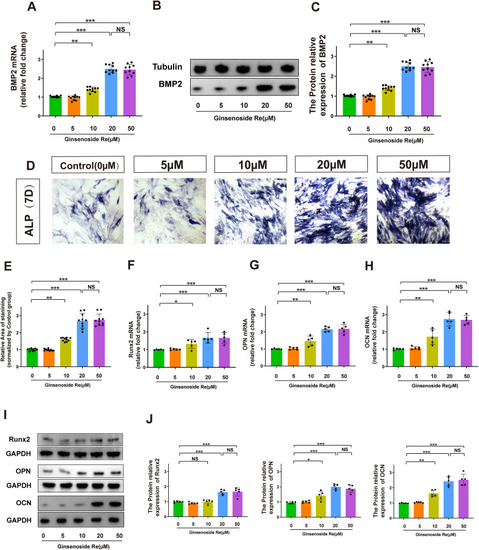
Ginsenoside Re promotes osteogenic differentiation of MEC3T3-E1 cell line by upregulating BMP-2 expression in vitro. A. The relative mRNA expression levels of BMP2 in MEC3T3-E1 cell line treated with various concentrations of Ginsenoside Re for 7 days. B-C. The expression of BMP-2 protein in MEC3T3 cells was analyzed by Western blot after treatment with Ginsenoside Re for 7 days. D-E. The results of alkaline phosphatase staining in MEC3T3-E1 cell line treated with various concentrations of Ginsenoside Re for 7 days. F-J. The relative mRNA expression levels and protein expression level of OCN, OPN, Runx2 in MEC3T3-E1 cell line treated with various concentrations of Ginsenoside Re for 7 days. Statistical methods: two-tailed Student's t-test, (∗P < 0.05, ∗∗P < 0.01, ∗∗∗P < 0.001). |
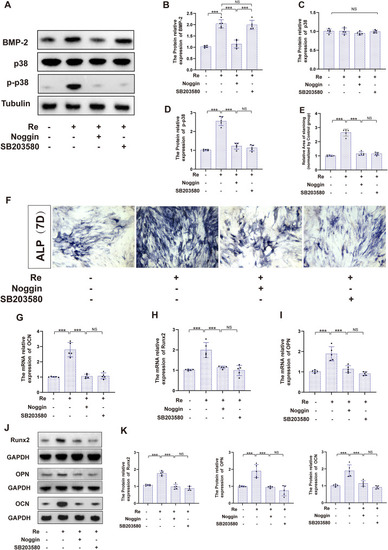
Ginsenoside Re promotes osteogenic differentiation of MEC3T3-E1 cells through the BMP/p38 pathway in vitro. A-D. Protein expression analysis of BMP2, p38, Phosphorylated p38 with co-treatments of Re (20 μM), BMP2 pathway inhibitor and p38 pathway inhibitor SB203580(100 ng/ml) in MEC3T3-E1 cell line. E-F. Alkaline phosphatase staining results of co-treatment with Re, noggin, and SB203580 in the MEC3T3-E1 cell line. G-I. The mRNA relative expression of OCN, OPN and Runx2 with co-treatments of Re, noggin, and SB203580 in the MEC3T3-E1 cell line. J-K. The protein relative expression of OCN, OPN and Runx2 with co-treatments of Re, noggin, and SB203580 in the MEC3T3-E1 cell line (n = 5). Statistical methods: two-tailed Student's t-test, (∗P < 0.05, ∗∗P < 0.01, ∗∗∗P < 0.001). |
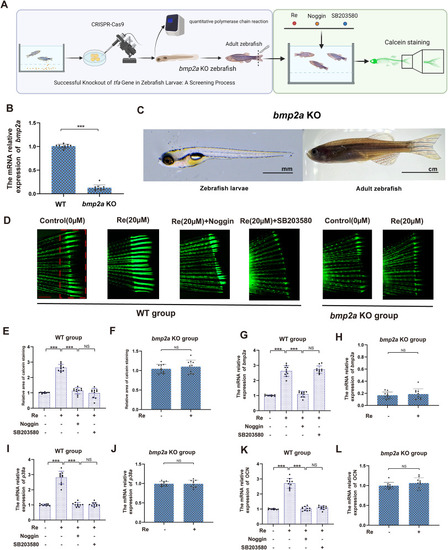
Ginsenoside Re modulates bone formation via the Bmp2/p38 pathway in vivo. A. The in vivo experimental demonstration illustrates the construction of the bmp2a knockout zebrafish model. After tail amputation surgery, both the bmp2a KO group and the control group were co-cultured with Re, noggin, and SB203580 for 7 days. The effects of Re, bmp2a and the p38 pathway(mapk14a) on zebrafish bone formation were evaluated using calcein green staining. B-C. After constructing the bmp2a knockout zebrafish model, qPCR technology was utilized to verify the knockout results. Additionally, the appearance of zebrafish larvae and adult fish after bmp2a knockout was demonstrated. D-F. The bone formation in the tail fin of the zebrafish models from the control group and the bmp2a KO group was assessed using calcein staining after treatment with Re, noggin and SB203580. G-L. The relative expression levels of osteocalcin, bmp2a, mapk14a mRNA in the tail fin of the zebrafish models from the bmp2a knockout group and the control group after treatment with Re, noggin and SB203580. Statistical methods: two-tailed Student's t-test, (∗P < 0.05, ∗∗P < 0.01, ∗∗∗P < 0.001). |
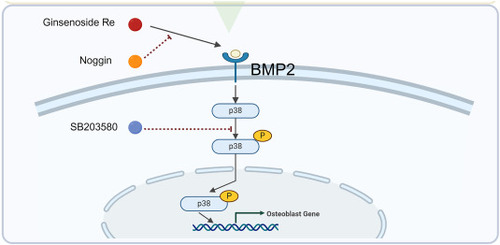
Schematic diagram illustrating the molecular mechanism of Ginsenoside Re's promotion of osteogenesis. |