
- Title
-
Dis3l2 is essential for neural crest survival by modulating Akt signaling
- Authors
- D'Silva, S., Prasad, T., Kumar, M.
- Source
- Full text @ Cell Commun. Signal.
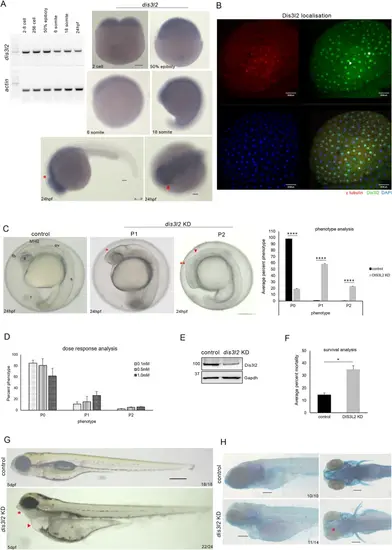
dis3l2 depletion results in neurodevelopmental defects A: RT-PCR analysis of dis3l2 transcripts in different developmental stages. Zebrafish actin was used as the loading control (left). Whole-mount RNA in situ hybridization showing dis3l2 transcripts during early development. Scale bars, 100 μm (right). B: Sum projection confocal image of 256-cell stage control embryos showing endogenous Dis3l2 localization. Blue/DAPI - DNA, green– DIS3L2, red– γ tubulin. Scale bars, 50 μm. C: Gross morphological analysis of dis3l2 depleted embryos by morpholino in comparison to control embryos at 24 hpf showing forebrain defects (red asterisks), midbrain-hindbrain boundary defects (red arrowhead) Quantification of percent phenotype of 1mM dis3l2 morphants as compared to stage-matched control. Data are shown as mean + SEM, *p < 0.05, **p < 0.01, ***p < 0.001. n = 3 for each experiment, with a minimum of 40 embryos per experiment. D: Percent phenotype of dis3l2 morphants in different concentrations of morpholino. E: Western blot analysis showing Dis3l2 levels by western blot in dis3l2 morpholino injected morphants. Gapdh was used as the loading control. F: Percent mortality of dis3l2 morphants with respect to control at 24 hpf. G: Bright field image of dis3l2 depleted larvae as compared to control larvae at 5 dpf. H: Skeletal preparations of dis3l2 morphants by bone and cartilage staining using Alizarin red S and Alcian blue respectively. Scale bars 50 μm |
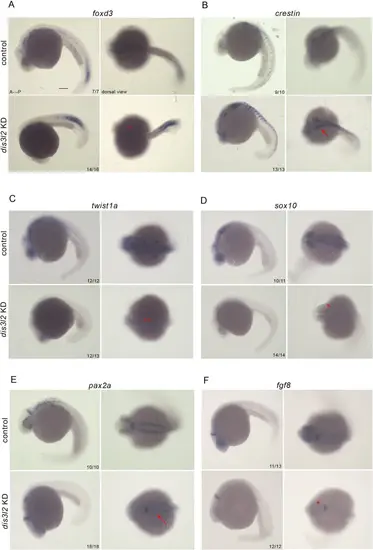
dis3l2 is crucial for the specification of neural crest cells. A, B: Gene expression analysis of foxd3 (red asterisk) and crestin (red arrow) in dis3l2 morphants with respect to control. C, D: Expression of twist1a (double red asterisks) and sox10 (single red asterisk) in dis3l2 morphants as compared to control. E, F: Gene expression of pax2a (red arrow) and fgf8 in dis3l2 morphants and control. Scale bars, 100 μm. n = 3 biological replicates with a minimum of 15 embryos per experiment |

dis3l2 is essential for neural crest survival. A: Skeletal preparation and head measurements of dis3l2 depleted larvae showing smaller head area with respect to control. B: Cell death analysis in the dis3l2 morphants by acridine orange staining. Acridine orange positive cells (white asterisk) shown in the head. Scale bars, 200 μm. C: Relative expression of Bcl2 family members– bim, puma, foxo, and bcl2 in dis3l2 morphants. Data are shown as mean + SEM, *p < 0.05, **p < 0.01, ***p < 0.001. n = 3 for each experiment, with a minimum of 100 embryos per experiment. D: Western blot analysis to show Caspase3 levels in morphants embryos. Gapdh was used as loading control. E: Western blot analysis showing phosphorylated Akt with respect to total Akt levels and phosphorylated Gsk3β with respect to total Gsk3β levels in dis3l2 depleted embryos. Gapdh was used as loading control. F: Rescue experiments showing phenotype P1 and P2 upon treatment with Akt activator SC79 in dis3l2 morpholino injected embryos. G: Cell death analysis by acridine orange staining in dis3l2 morpholino injected embryos treated with SC79 and WT embryos treated with SC79 |
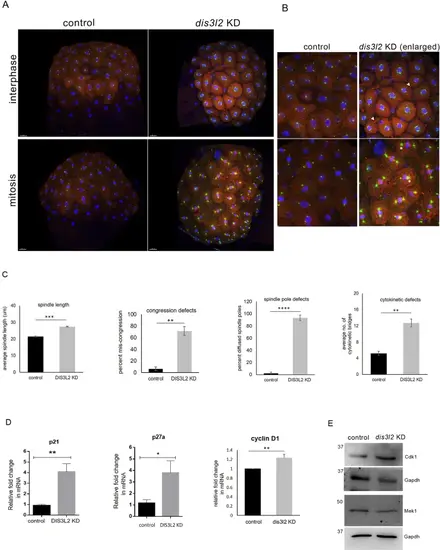
dis3l2 is required for early embryonic mitoses A: Sum projection confocal image of 256 cell stage control and dis3l2 morphants embryos showing mitotic defects. Blue/DAPI - DNA, red– alpha-tubulin, green– γ tubulin. B: Enlarged sum projection confocal image of dis3l2 morphants showing cytokinetic index (white arrowhead), spindle length (white dotted line), and spindle poles (white asterisks) during early mitoses. Scale bars, 50 μm. C: Quantification of spindle length (white dotted line), chromosome congression, spindle pole (white asterisk), and cytokinesis (white arrowhead) in the dis3l2 morphants as compared to control. Scale bars, 50 μm. All data are shown as mean + SEM. *p < 0.05, **p < 0.01, ***p < 0.001. n = 3 for each experiment, with a minimum of 20 embryos per experiment. D: Relative expression of cell cycle regulators– p21, p27, and cyclinD1 in dis3l2 morphants. Data are shown as mean + SEM, *p < 0.05, **p < 0.01, ***p < 0.001. n = 3 for each experiment, with a minimum of 100 embryos per experiment. E: Western blot analysis showing Cdk1 and Mek1 levels in dis3l2-depleted embryos as compared to control. Gapdh was used as the loading control |

Summary of developmental functions of dis3l2. Schematic representation to synopsize the role of dis3l2 in early embryogenesis. dis3l2 depletion results in reduced Akt and Gsk3β signaling, resulting in upregulation of apoptosis pathways involving bim, puma, foxo and effector Caspases. This results in massive surge of apoptosis in the embryonic neural tissue. Concomitantly, dis3l2 depletion also results in upregulation of cell cycle regulators such as Cdk1, p21 and p27, which in turn further upregulate the apoptotic mechanisms. Hence, the embryos show myriad of mitotic defects during early embryogenesis. Additionally, the dis3l2 morphants exhibit reduced expression of neural crest specifier genes, resulting in severe craniofacial anomalies at larval stages |