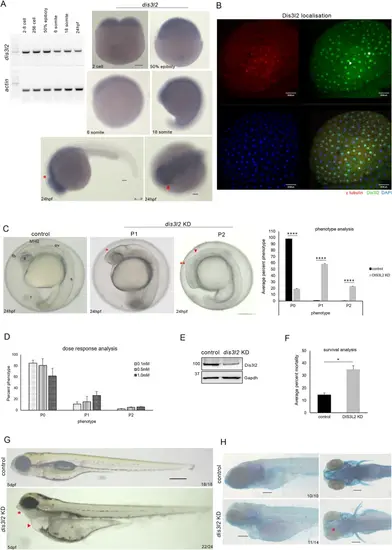
dis3l2 depletion results in neurodevelopmental defects A: RT-PCR analysis of dis3l2 transcripts in different developmental stages. Zebrafish actin was used as the loading control (left). Whole-mount RNA in situ hybridization showing dis3l2 transcripts during early development. Scale bars, 100 μm (right). B: Sum projection confocal image of 256-cell stage control embryos showing endogenous Dis3l2 localization. Blue/DAPI - DNA, green– DIS3L2, red– γ tubulin. Scale bars, 50 μm. C: Gross morphological analysis of dis3l2 depleted embryos by morpholino in comparison to control embryos at 24 hpf showing forebrain defects (red asterisks), midbrain-hindbrain boundary defects (red arrowhead) Quantification of percent phenotype of 1mM dis3l2 morphants as compared to stage-matched control. Data are shown as mean + SEM, *p < 0.05, **p < 0.01, ***p < 0.001. n = 3 for each experiment, with a minimum of 40 embryos per experiment. D: Percent phenotype of dis3l2 morphants in different concentrations of morpholino. E: Western blot analysis showing Dis3l2 levels by western blot in dis3l2 morpholino injected morphants. Gapdh was used as the loading control. F: Percent mortality of dis3l2 morphants with respect to control at 24 hpf. G: Bright field image of dis3l2 depleted larvae as compared to control larvae at 5 dpf. H: Skeletal preparations of dis3l2 morphants by bone and cartilage staining using Alizarin red S and Alcian blue respectively. Scale bars 50 μm
|
