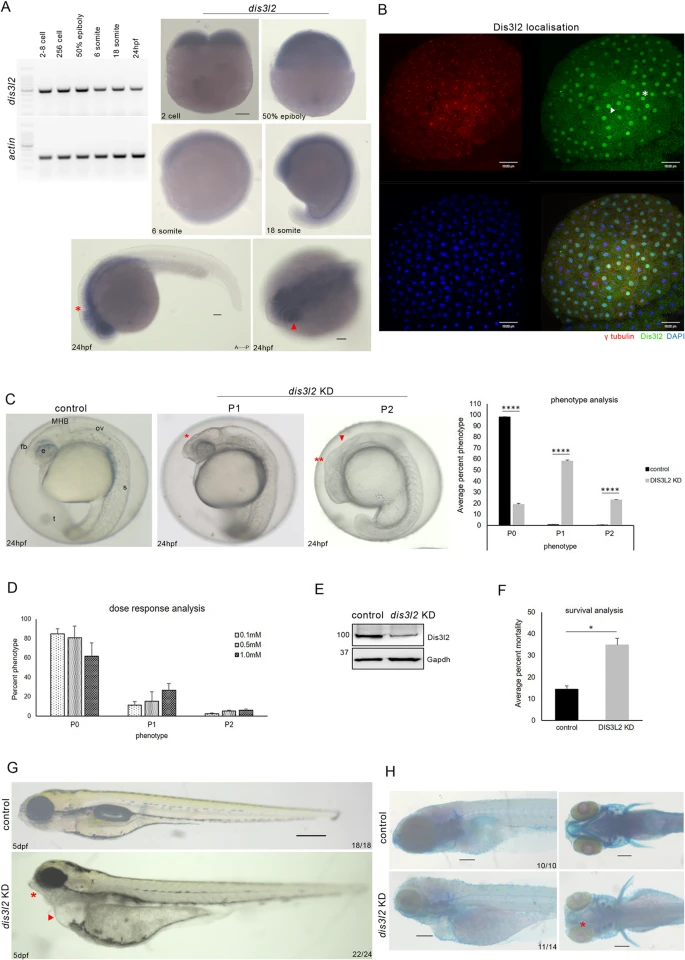
Fig. 1 dis3l2 depletion results in neurodevelopmental defects A: RT-PCR analysis of dis3l2 transcripts in different developmental stages. Zebrafish actin was used as the loading control (left). Whole-mount RNA in situ hybridization showing dis3l2 transcripts during early development. Scale bars, 100 μm (right). B: Sum projection confocal image of 256-cell stage control embryos showing endogenous Dis3l2 localization. Blue/DAPI - DNA, green– DIS3L2, red– γ tubulin. Scale bars, 50 μm. C: Gross morphological analysis of dis3l2 depleted embryos by morpholino in comparison to control embryos at 24 hpf showing forebrain defects (red asterisks), midbrain-hindbrain boundary defects (red arrowhead) Quantification of percent phenotype of 1mM dis3l2 morphants as compared to stage-matched control. Data are shown as mean + SEM, *p < 0.05, **p < 0.01, ***p < 0.001. n = 3 for each experiment, with a minimum of 40 embryos per experiment. D: Percent phenotype of dis3l2 morphants in different concentrations of morpholino. E: Western blot analysis showing Dis3l2 levels by western blot in dis3l2 morpholino injected morphants. Gapdh was used as the loading control. F: Percent mortality of dis3l2 morphants with respect to control at 24 hpf. G: Bright field image of dis3l2 depleted larvae as compared to control larvae at 5 dpf. H: Skeletal preparations of dis3l2 morphants by bone and cartilage staining using Alizarin red S and Alcian blue respectively. Scale bars 50 μm
Image
Figure Caption
Figure Data
Acknowledgments
This image is the copyrighted work of the attributed author or publisher, and
ZFIN has permission only to display this image to its users.
Additional permissions should be obtained from the applicable author or publisher of the image.
Full text @ Cell Commun. Signal.

