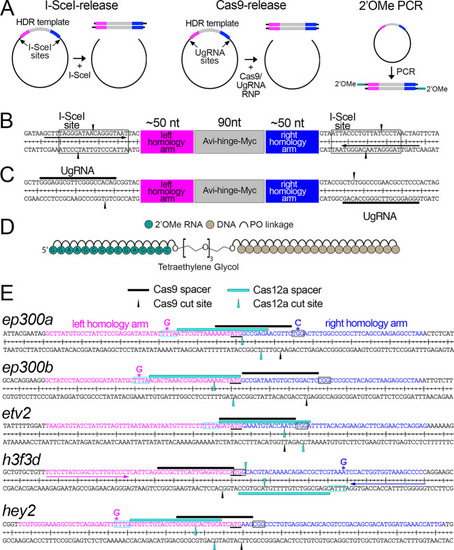
Target genes and sequences. (A) Schematic of linear HDR templates, released from plasmids by co-injection with I-SceI or Cas9, or amplified by PCR. (B,C) Plasmid vector backbones for in vivo release of HDR templates by I-SceI (B) or Cas9 (C) digestion. (B) I-SceI site is indicated by the box and cleavage sites indicated by black arrowheads. Arrows denote forward and reverse priming site for universal PCR primer. (C) UgRNA spacer sequence is indicated by black lines. The site of Cas9-induced DSB is shown by black arrowheads. (D) Schematic of the modified oligonucleotide primer used for PCR. PO, phosphodiester. (E) Target genes for HDR-mediated insertion. Black and cyan lines denote Cas9 and Cas12a spacer sequences, respectively. A line located above or below the sequence indicates CRISPR spacer target on the positive or negative strand, respectively. Boxes indicate the PAM. Black and cyan arrowheads denote the location of Cas9 and Cas12a cleavage sites, respectively. Note that Cas12a leaves a 5′ overhang. The start codon at each target is underlined. Asterisks indicate the location of PAM mutations engineered into HDR templates. Left and right homology arm sequences are magenta and blue, respectively. For h3f3d, forward and reverse gene-specific primers are indicated by magenta and blue arrows, respectively.
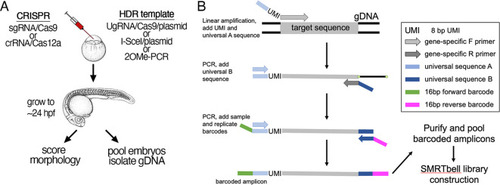
Experimental design for quantifying somatic repair events. (A) Schematic showing the steps to inject CRISPR RNPs and HDR templates at the one-cell stage, followed by scoring and isolation of genomic DNA. (B) Schematic describing the step-by-step construction of amplicon libraries for long-read sequencing. F, forward; R, reverse; UMI, unique molecular identifier.
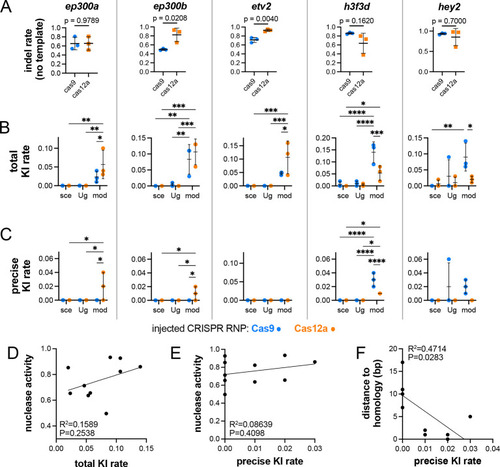
Quantification and comparison of repair events with different HDR templates and CRISPR nucleases. (A) Indel rates in embryos injected only with Cas9 or Cas12a targeting the indicated gene in the absence of HDR template. Unpaired t-test for all except hey2 for which a Mann–Whitney test was used due to the non-normal distribution of this sample; P-values indicated. (B) Total KI rate at the indicated locus, considering any integration of the epitope tag sequence. (C) Precise KI rate. (B,C) Template type indicated on x-axis. mod, linearized template amplified by PCR with 2′OMe-modified primers; sce, plasmid linearized with I-SceI; Ug, plasmid linearized with Cas9 targeting universal vector sgRNA spacers. *P<0.05, **P<0.01, ***P<0.001, ****P<0.0001 (two-way analysis of variance, Šidák's multiple comparison test). In A-C, error bars represent s.d.; n=3. (D-F) Comparison of nuclease activity (indel rate in the absence of HDR template) and total KI rate (D), nuclease activity and precise KI rate (E) and distance from the cleavage site to start of exogenous sequence and precise KI rate (F).
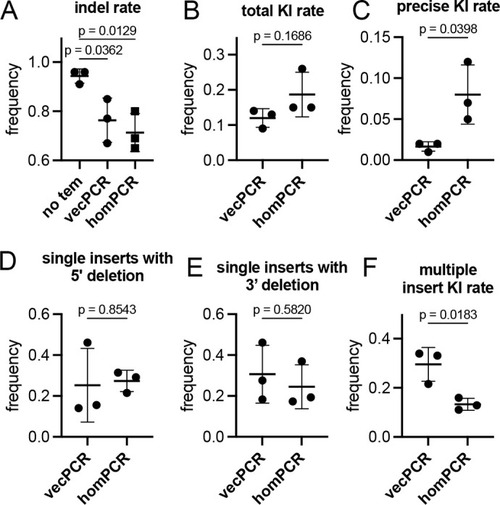
Homology-matched HDR template improves precise knock-in rates. (A) Indel rates with Cas9 RNP alone (no tem), or co-injected with HDR templates targeting the h3f3d ATG that were PCR-amplified with vector (vecPCR) or homology-matched (homPCR) primers. (B-F) Frequencies of targeted insertion of indicated repair event using vector or homology-matched template at the h3f3d locus. P-values are indicated (unpaired t-test). Error bars represent s.d.; n=3.
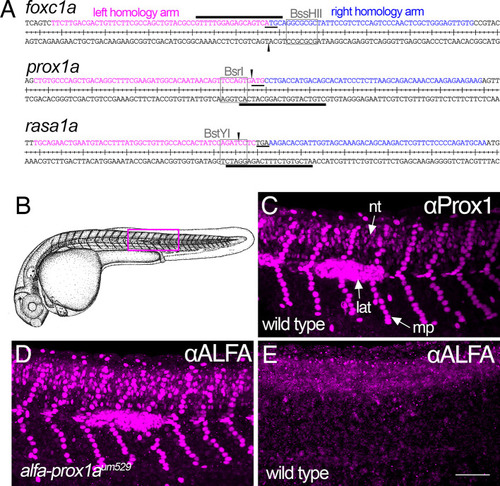
Targeted insertion of an ALFA tag using optimized knock-in parameters. (A) Sequence and flanking target insertion sites for foxc1a, prox1a and rasa1a. Left and right homology arms are indicated by magenta and blue, respectively. Black lines denote the Cas9 spacer sequence (line above or below sequence denotes positive or negative strand, respectively) and arrowheads mark the DSB sites. Start or stop codons are underlined. Restriction enzyme sites used to estimate nuclease activity are indicated by boxes and labeled. (B) Camera lucida of a zebrafish embryo at 31 hpf. Reproduced with permission from Kimmel et al. (1995). (C-E) Whole-mount immunostained embryos imaged by confocal microscopy; lateral views, anterior to the left, dorsal is up. (C) Wild-type embryos immunostained with polyclonal Prox1 antibody. Arrows denote fluorescence in neural tube (nt), lateral line primordium (lat) and muscle pioneers (mp). (D,E) Immunostaining of alfa-prox1aum529 heterozygous (D) and wild-type sibling (E) embryos with a nanobody against ALFA. Scale bar: 80 µm.
Acknowledgments
This image is the copyrighted work of the attributed author or publisher, and
ZFIN has permission only to display this image to its users.
Additional permissions should be obtained from the applicable author or publisher of the image.
Full text @ Development
Your Input Welcome
Thank you for submitting comments. Your input has been emailed to ZFIN curators who may contact you if
additional information is required.
Oops. Something went wrong. Please try again later.