IMAGE

Fig. 3.

ID
ZDB-IMAGE-250702-74
Source
Figures for Oikemus et al., 2025
Image
Figure Caption

Fig. 3.

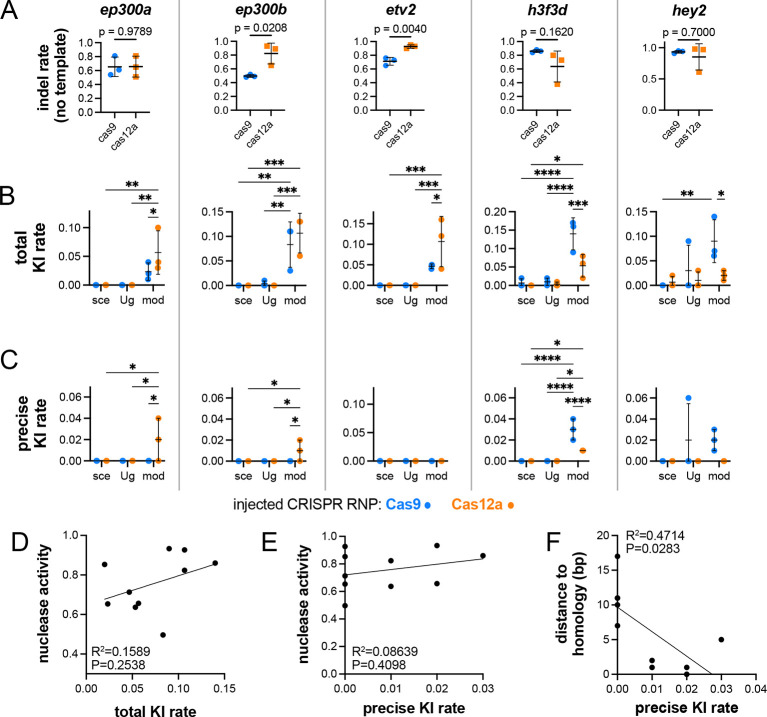
Quantification and comparison of repair events with different HDR templates and CRISPR nucleases. (A) Indel rates in embryos injected only with Cas9 or Cas12a targeting the indicated gene in the absence of HDR template. Unpaired t-test for all except hey2 for which a Mann–Whitney test was used due to the non-normal distribution of this sample; P-values indicated. (B) Total KI rate at the indicated locus, considering any integration of the epitope tag sequence. (C) Precise KI rate. (B,C) Template type indicated on x-axis. mod, linearized template amplified by PCR with 2′OMe-modified primers; sce, plasmid linearized with I-SceI; Ug, plasmid linearized with Cas9 targeting universal vector sgRNA spacers. *P<0.05, **P<0.01, ***P<0.001, ****P<0.0001 (two-way analysis of variance, Šidák's multiple comparison test). In A-C, error bars represent s.d.; n=3. (D-F) Comparison of nuclease activity (indel rate in the absence of HDR template) and total KI rate (D), nuclease activity and precise KI rate (E) and distance from the cleavage site to start of exogenous sequence and precise KI rate (F).

Acknowledgments
This image is the copyrighted work of the attributed author or publisher, and ZFIN has permission only to display this image to its users. Additional permissions should be obtained from the applicable author or publisher of the image. Full text @ Development