IMAGE

Fig. 1.

ID
ZDB-IMAGE-250702-73
Source
Figures for Oikemus et al., 2025
Image
Figure Caption

Fig. 1.

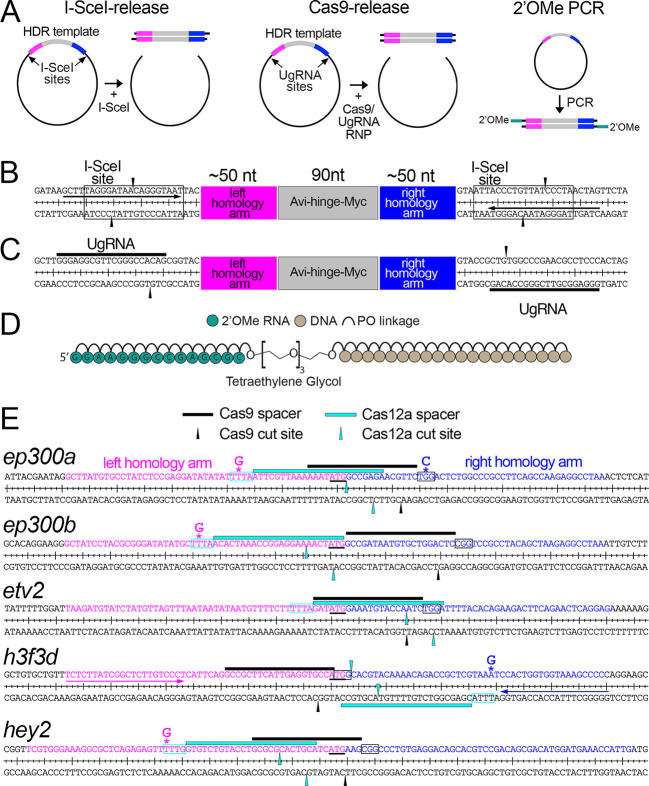
Target genes and sequences. (A) Schematic of linear HDR templates, released from plasmids by co-injection with I-SceI or Cas9, or amplified by PCR. (B,C) Plasmid vector backbones for in vivo release of HDR templates by I-SceI (B) or Cas9 (C) digestion. (B) I-SceI site is indicated by the box and cleavage sites indicated by black arrowheads. Arrows denote forward and reverse priming site for universal PCR primer. (C) UgRNA spacer sequence is indicated by black lines. The site of Cas9-induced DSB is shown by black arrowheads. (D) Schematic of the modified oligonucleotide primer used for PCR. PO, phosphodiester. (E) Target genes for HDR-mediated insertion. Black and cyan lines denote Cas9 and Cas12a spacer sequences, respectively. A line located above or below the sequence indicates CRISPR spacer target on the positive or negative strand, respectively. Boxes indicate the PAM. Black and cyan arrowheads denote the location of Cas9 and Cas12a cleavage sites, respectively. Note that Cas12a leaves a 5′ overhang. The start codon at each target is underlined. Asterisks indicate the location of PAM mutations engineered into HDR templates. Left and right homology arm sequences are magenta and blue, respectively. For h3f3d, forward and reverse gene-specific primers are indicated by magenta and blue arrows, respectively.

Acknowledgments
This image is the copyrighted work of the attributed author or publisher, and ZFIN has permission only to display this image to its users. Additional permissions should be obtained from the applicable author or publisher of the image. Full text @ Development