
- Title
-
Muscle peripheral circadian clock drives nocturnal protein degradation via raised Ror/Rev-erb balance and prevents premature sarcopenia
- Authors
- Kelu, J.J., Hughes, S.M.
- Source
- Full text @ Proc. Natl. Acad. Sci. USA
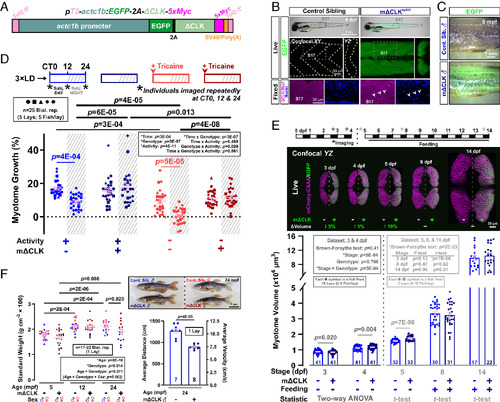
Inhibition of the muscle peripheral clock disrupts muscle clock output and alters circadian muscle growth. (A) Design of the muscle-specific dominant negative clock (mΔCLK) construct. (B) Brightfield/EGFP overlay (top row) showing the gross morphology of control and mΔCLK siblings at 4 dpf. Confocal XY (parasagittal) and YZ (transverse) slices of trunk musculature (boxes) showing uniform EGFP (live; middle row) and Myc-tagged-ΔCLK in myonuclei counterstained with Hoechst 33342 (fixed; bottom row). Arrowheads indicate Myc-positive myonuclei. (C) Brightfield/EGFP overlay showing persistence of EGFP in skinned myotome of mΔCLK but none in control sibling (Cont. Sib.) fish at 5 mpf. (D) Circadian muscle growth of myotome 17 from 3 to 4 dpf (% change) measured with actc1b:mCherryCAAX in control and mΔCLK siblings. Muscle growth of individual larvae (3xLD entrained) was tracked every 12 h (*) under free-run conditions (constant light) between 3 and 4 dpf as shown in schematics. Sibling control (light color symbols in all Figures) and mΔCLK transgenic (dark color symbols) were either unanesthetized (active; blue symbols) or anesthetized (inactive, arrowhead; red symbols). CT is circadian time. CT0-12 and CT12-24 are subjective (subj.) day and night, respectively. Statistics are three-way ANOVA (Time/Treatment/Genotype) with Bonferroni’s post hoc test. (E) Myotome volume measured at 3, 4, 5, 8, and 14 dpf in control and mΔCLK siblings that were raised under LD. Single confocal YZ (transverse) slices show muscle cross-sectional area visualized with actc1b:mCherryCAAX without (Left) or with mΔCLK (right; EGFP marker). Schematic above shows imaging and feeding timeline; break indicates separate biological replicates at 3 and 4 dpf from 5, 8, and 14 dpf. Statistics are two-way ANOVA (Stage/Genotype) with Bonferroni’s post hoc test for the 3 and 4 dpf dataset, and unpaired t test for the individual 5, 8, and 14 dpf datasets (unequal variance shown with Brown–Forsythe and F-tests precluded ANOVA). (F) Brightfield images (Top) showing the gross morphology of control and mΔCLK siblings at 24 mpf. Standard weight of male (blue) and female (red) control and mΔCLK siblings, measured at 5, 12, and 24 mpf. Statistics are two-way ANOVA (Age/Genotype) and three-way ANOVA (Age/Genotype/Sex) with Bonferroni’s post hoc test. Average swimming distance and velocity measured at 24 mpf; statistics are unpaired t test. |
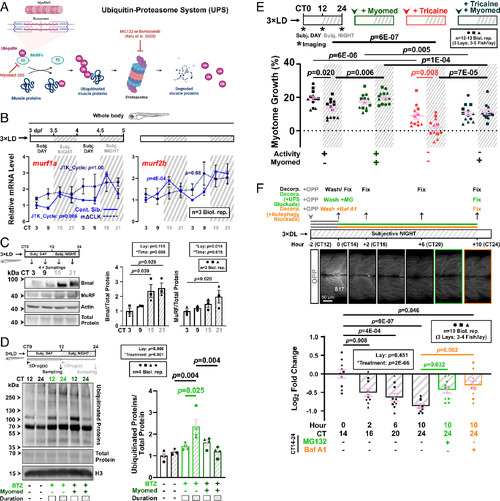
MuRF accumulation at night limits nocturnal muscle growth. (A) The UPS pathway highlighting relevant proteins and inhibitors (red). (B) Circadian mRNA profiles of muscle-specific E3 ligase transcripts murf1a/trim63a and murf2b/trim55b in control (blue, solid line) and mΔCLK siblings (dark blue, dotted line). RNA collected from 3xLD entrained fish under free-run was analyzed by RT-qPCR (SI Appendix, Fig. S1C). Statistics from JTK_Cycle. (C) Circadian accumulation of MuRF and Bmal proteins under free-run between 3 and 4 dpf analyzed by western blotting. Note that MuRF antibody may detect the products of more than one zebrafish MuRF gene and that protein quantifications are relative to total protein in the sample. Statistics are two-way ANOVA (Lay/Time) with Bonferroni’s post hoc test. (D) Circadian variations in proteasomal degradation of ubiquitinated proteins. Larvae under free-run between 3 and 4 dpf were treated with either DMSO, bortezomib (BTZ) alone, or BTZ and Myomed during either CT0-12 or CT12-24, and protein analyzed by western blotting. Statistics are two-way ANOVA (Lay/Treatment) with Bonferroni’s post hoc test. (E) Circadian muscle growth after MuRF inhibition in larvae under free-run between 3 and 4 dpf that were either active or inactive and treated with DMSO or Myomed. Statistics are two-way ANOVA (Time/Treatment) with Bonferroni’s post hoc test. (F) Nocturnal protein degradation in muscle measured by OPP decorporation. Newly synthesized proteins in DL-entrained larvae at 3 dpf were labeled with OPP between CT12 and 14 and allowed to degrade overnight under free-run. Fish fixed at 0, 2, 6, and 10 h post OPP-washout were imaged in single confocal XY parasagittal slices and OPP signal in S17 visualized with fluorescent Click-iT chemistry and quantified after background subtraction (SI Appendix, Fig. S5 D and E). MG132 (green symbols) or bafilomycin A1 (orange symbols) treatment after OPP-washout reduced decorporation. Log2 fold change in fluorescence signal relative to control samples at 0 h. Statistics are two-way ANOVA (Lay/Treatment) with Bonferroni’s post hoc test. |
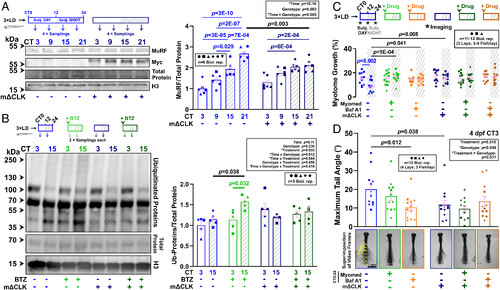
Inhibition of the muscle clock disrupts circadian variations in proteasomal flux in the muscle. (A) Effect of muscle clock inhibition on circadian accumulation of MuRF in control and mΔCLK sibling larvae under free-run between 3 and 4 dpf. MuRF and Myc-tagged ΔCLK abundance were normalized to total protein. Statistics are two-way ANOVA (Time/Genotype) with Bonferroni’s post hoc test. (B) Effect of muscle clock inhibition on circadian variations in proteasomal degradation of ubiquitinated proteins in control and mΔCLK sibling larvae under free-run between 3 and 4 dpf treated from CT0 with either DMSO or bortezomib (BTZ), and protein analyzed by western blotting at CT3 and CT15. Statistics are three-way ANOVA (Time/Genotype/Treatment) with Bonferroni’s post hoc test. (C and D) Circadian myotome growth between 3 and 4 dpf (C) or tail displacement at 4 dpf (D) measured in control and mΔCLK sibling larvae under free-run that were treated from CT0-24 with either DMSO, Myomed, or bafilomycin A1 (Baf A1). Images (D) are superimposition of video frames. Statistics are two-way ANOVA (Time/Treatment) with Bonferroni’s post hoc test. |
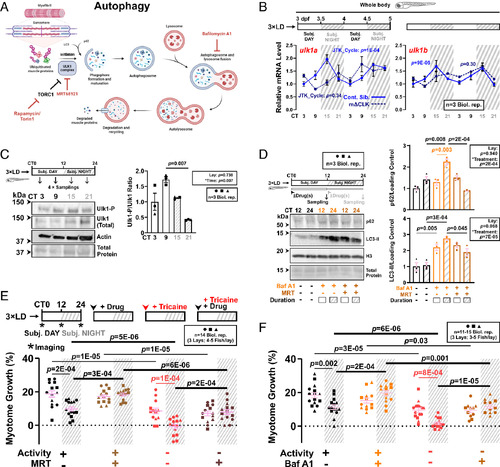
Ulk1-dependent autophagy activation at night limits nocturnal muscle growth. (A) The autophagy pathway highlighting relevant proteins and inhibitors (red). (B) Circadian mRNA levels of ulk1a and ulk1b in 3xLD entrained whole larvae of control and mΔCLK siblings under free-run analyzed by RT-qPCR (SI Appendix, Fig. S1C). Statistics from JTK_Cycle. (C) Circadian oscillation in Ulk1Ser757 phosphorylation in larvae under free-run between 3 and 4 dpf assessed by western blotting. Statistics are two-way ANOVA (Lay/Time) with Bonferroni’s post hoc test. (D) Circadian variations in autophagic degradation of p62 and LC3-II in larvae under free-run treated with DMSO, bafilomycin A1 (Baf A1) alone, or both Baf A1 and MRT68921 (MRT) during either CT0-12 or CT12-24 and analyzed by western blotting. Statistics are two-way ANOVA (Lay/Treatment) with Bonferroni’s post hoc test. (E and F) Circadian myotome growth after autophagy inhibition in entrained active or inactive larvae treated under free-run between 3 and 4 dpf with DMSO, MRT68921 (E), or bafilomycin A1 (F). Statistics are two-way ANOVA (Time/Treatment) with Bonferroni’s post hoc test. |
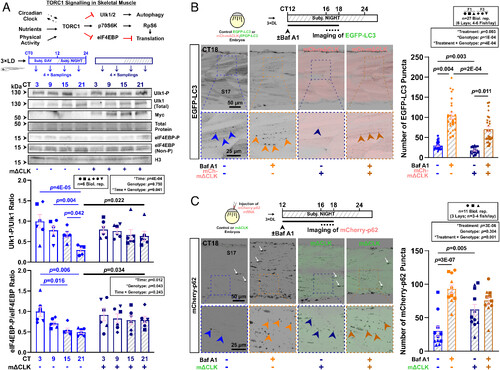
Inhibition of the muscle clock reduces autophagosome formation and autophagic activity in muscle at night. (A) The TORC1 signaling pathway in skeletal muscle highlighting relevant downstream effectors. Effect of muscle clock inhibition on circadian oscillation of Ulk1Ser757 and eIF4EBPThr37/46 phosphorylation in entrained larvae under free-run between 3 and 4 dpf in control and mΔCLK siblings. Statistics are two-way ANOVA (Time/Genotype) with Bonferroni’s post hoc test. (B) Autophagic flux in muscle measured in Tg(CMV:EGFP-map1lc3b)zf155 control and sibling Tg(CMV:EGFP-map1lc3b)zf155;mCherry-mΔCLKkg334Tg DL-entrained larvae under free-run between 3 and 4 dpf treated with DMSO or bafilomycin A1 (Baf A1) at CT12 for 4 to 6 h. Confocal parasagittal images at CT16-18 visualized the number of EGFP-LC3 puncta (arrowheads) in S17. Statistics are two-way ANOVA (Treatment/Genotype) with Bonferroni’s post hoc test. F1/F3, filial generation. (C) Autophagic flux in muscle measured with mCherry-p62 mRNA injection at one-cell stage into sibling control and EGFP-mΔCLKkg333Tg transgenic embryos, which were entrained and under free-run treated with DMSO or bafilomycin A1 (Baf A1) at CT12 for 4 to 6 h. Confocal parasagittal images at CT16-18 visualized the number of mCherry-p62 puncta (arrowheads) in sarcoplasm in S17. Some signals also associated with nuclei (white arrows), as previously reported (28, 29). Statistics are two-way ANOVA (Treatment/Genotype) with Bonferroni’s post hoc test. |
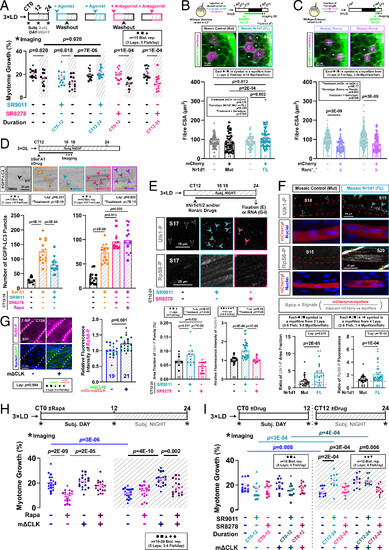
Nr1d1 promotes muscle growth by suppressing autophagy via TORC1 activation. (A) Circadian muscle growth after Nr1d1/2 activation (SR9011) or inhibition (SR8278) during subjective day (CT0-12) or night (CT12-24) measured in entrained actc1b:mCherryCAAX larvae under free-run treated with drug or DMSO control. Statistics are two-way ANOVA (Time/Treatment) with Bonferroni’s post hoc test. (B and C) Effect of Nr1d1 (B) or Rorca/b (C) mosaic overexpression on myofiber growth in embryos injected at one-cell stage with DNA encoding either mutant (Mut) or full-length (FL) mCherry-2A-Nr1d1 (B; see also SI Appendix, Fig. S11B), or full-length mCherry-2A-Rorca/b (see SI Appendix, Fig. S11E). Entrained larvae were labeled with BODIPY-Ceramide and single confocal transverse slices at 4 dpf at ZT3 permitted quantification of cross-sectional area of transgenic (+) and nontransgenic (−) myofibers in S15−S18. Statistics are two-way ANOVA (Treatment/Genotype) with Bonferroni’s post hoc test. ZT, zeitgeber time. (D) Effect of Nr1d1/2 agonism or antagonism on nocturnal autophagic flux measured with Tg(CMV:EGFP-map1lc3b) in DL-entrained larvae under free-run between 3 and 4 dpf treated from CT12 with either DMSO, bafilomycin A1 (Baf A1), or Baf A1 and SR9011, SR8278, or rapamycin. Single confocal parasagittal slices between CT16 and 18 permitted quantification of EGFP-LC3 puncta (arrowheads). Statistics are two-way ANOVA (Lay/Treatment) with Bonferroni’s post hoc test. (E) Effects of Nr1d1/2 agonism or antagonism on TORC1-mediated phosphorylation of Ulk1Ser757 in muscle. Entrained larvae under free-run between 3 and 4 dpf were treated from CT12 with either DMSO, SR9011, or SR8278 and then fixed at CT24. After immunodetection, phosphorylated Ulk1Ser757 puncta (arrowheads) and RpS6Ser240/244 intensity were quantified in single confocal parasagittal slices in S17. Statistics are two-way ANOVA (Lay/Treatment) with Bonferroni’s post hoc test. (F) Effects of Nr1d1 mosaic overexpression on TORC1-mediated phosphorylation of Ulk1Ser757 and RpS6Ser240/244 in myofibers in entrained 4 dpf larvae from embryos injected at the one-cell stage with either Mut or FL mCherry-2A-Nr1d1. After immunodetection and nuclear counterstain, phosphorylated Ulk1Ser757 puncta (arrowheads) and RpS6Ser240/244 intensity were quantified in single confocal parasagittal slices in mCherry-expressing myofibers (red dashes) and their neighbors in S10−S22. Asterisks denote unspecific labeling of RpS6-PSer240/244 at myosepta (SI Appendix, Fig. S10B). The ratio of fluorescent signals between pairs of neighboring mCherry-positive and -negative myofibers was calculated as indicated in inset. Statistics are two-way ANOVA (Lay/Treatment) with Bonferroni’s post hoc test. (G) Effect of muscle clock inhibition on TORC1 activity in the muscle in sibling control and mΔCLK entrained larvae under free-run fixed at CT24. After immunodetection and nuclear counterstain, phosphorylated RpS6Ser240/244 intensity was quantified in single confocal parasagittal slices in S17 (white dashes). Asterisks denote unspecific labeling of RpS6Ser240/244-P at myosepta (SI Appendix, Fig. S10B). EGFP reflects ΔCLK expression. Statistics are two-way ANOVA (Lay/Genotype) with Bonferroni’s post hoc test (symbol colors indicate lays from EGFP-mΔCLK and mCherry-mΔCLK outcrosses). (H) Effect of TORC1 inhibition on circadian muscle growth measured in sibling control and mΔCLK entrained larvae under free-run between 3 and 4 dpf treated from CT0-24 with either DMSO or rapamycin. Statistics are three-way ANOVA (Time/Genotype/Treatment) with Bonferroni’s post hoc test. (I) Circadian muscle growth measured in sibling control and mΔCLK entrained larvae under free-run between 3 and 4 dpf treated with either DMSO, SR9011, or SR8278 during either CT0-12 or CT12-24. Statistics are two-way ANOVA (Treatment/Genotype) with Bonferroni’s post hoc test. Due to the size of the experiment, different lays were used at CT0-12 and CT12-24. |