
Fig. 6
- ID
- ZDB-FIG-250814-52
- Publication
- Kelu et al., 2025 - Muscle peripheral circadian clock drives nocturnal protein degradation via raised Ror/Rev-erb balance and prevents premature sarcopenia
- Other Figures
- All Figure Page
- Back to All Figure Page
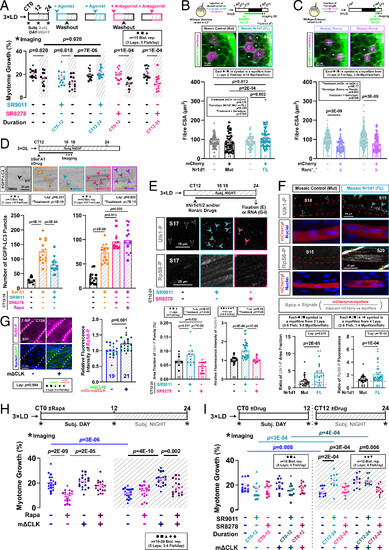
Nr1d1 promotes muscle growth by suppressing autophagy via TORC1 activation. (A) Circadian muscle growth after Nr1d1/2 activation (SR9011) or inhibition (SR8278) during subjective day (CT0-12) or night (CT12-24) measured in entrained actc1b:mCherryCAAX larvae under free-run treated with drug or DMSO control. Statistics are two-way ANOVA (Time/Treatment) with Bonferroni’s post hoc test. (B and C) Effect of Nr1d1 (B) or Rorca/b (C) mosaic overexpression on myofiber growth in embryos injected at one-cell stage with DNA encoding either mutant (Mut) or full-length (FL) mCherry-2A-Nr1d1 (B; see also SI Appendix, Fig. S11B), or full-length mCherry-2A-Rorca/b (see SI Appendix, Fig. S11E). Entrained larvae were labeled with BODIPY-Ceramide and single confocal transverse slices at 4 dpf at ZT3 permitted quantification of cross-sectional area of transgenic (+) and nontransgenic (−) myofibers in S15−S18. Statistics are two-way ANOVA (Treatment/Genotype) with Bonferroni’s post hoc test. ZT, zeitgeber time. (D) Effect of Nr1d1/2 agonism or antagonism on nocturnal autophagic flux measured with Tg(CMV:EGFP-map1lc3b) in DL-entrained larvae under free-run between 3 and 4 dpf treated from CT12 with either DMSO, bafilomycin A1 (Baf A1), or Baf A1 and SR9011, SR8278, or rapamycin. Single confocal parasagittal slices between CT16 and 18 permitted quantification of EGFP-LC3 puncta (arrowheads). Statistics are two-way ANOVA (Lay/Treatment) with Bonferroni’s post hoc test. (E) Effects of Nr1d1/2 agonism or antagonism on TORC1-mediated phosphorylation of Ulk1Ser757 in muscle. Entrained larvae under free-run between 3 and 4 dpf were treated from CT12 with either DMSO, SR9011, or SR8278 and then fixed at CT24. After immunodetection, phosphorylated Ulk1Ser757 puncta (arrowheads) and RpS6Ser240/244 intensity were quantified in single confocal parasagittal slices in S17. Statistics are two-way ANOVA (Lay/Treatment) with Bonferroni’s post hoc test. (F) Effects of Nr1d1 mosaic overexpression on TORC1-mediated phosphorylation of Ulk1Ser757 and RpS6Ser240/244 in myofibers in entrained 4 dpf larvae from embryos injected at the one-cell stage with either Mut or FL mCherry-2A-Nr1d1. After immunodetection and nuclear counterstain, phosphorylated Ulk1Ser757 puncta (arrowheads) and RpS6Ser240/244 intensity were quantified in single confocal parasagittal slices in mCherry-expressing myofibers (red dashes) and their neighbors in S10−S22. Asterisks denote unspecific labeling of RpS6-PSer240/244 at myosepta (SI Appendix, Fig. S10B). The ratio of fluorescent signals between pairs of neighboring mCherry-positive and -negative myofibers was calculated as indicated in inset. Statistics are two-way ANOVA (Lay/Treatment) with Bonferroni’s post hoc test. (G) Effect of muscle clock inhibition on TORC1 activity in the muscle in sibling control and mΔCLK entrained larvae under free-run fixed at CT24. After immunodetection and nuclear counterstain, phosphorylated RpS6Ser240/244 intensity was quantified in single confocal parasagittal slices in S17 (white dashes). Asterisks denote unspecific labeling of RpS6Ser240/244-P at myosepta (SI Appendix, Fig. S10B). EGFP reflects ΔCLK expression. Statistics are two-way ANOVA (Lay/Genotype) with Bonferroni’s post hoc test (symbol colors indicate lays from EGFP-mΔCLK and mCherry-mΔCLK outcrosses). (H) Effect of TORC1 inhibition on circadian muscle growth measured in sibling control and mΔCLK entrained larvae under free-run between 3 and 4 dpf treated from CT0-24 with either DMSO or rapamycin. Statistics are three-way ANOVA (Time/Genotype/Treatment) with Bonferroni’s post hoc test. (I) Circadian muscle growth measured in sibling control and mΔCLK entrained larvae under free-run between 3 and 4 dpf treated with either DMSO, SR9011, or SR8278 during either CT0-12 or CT12-24. Statistics are two-way ANOVA (Treatment/Genotype) with Bonferroni’s post hoc test. Due to the size of the experiment, different lays were used at CT0-12 and CT12-24. |