
|
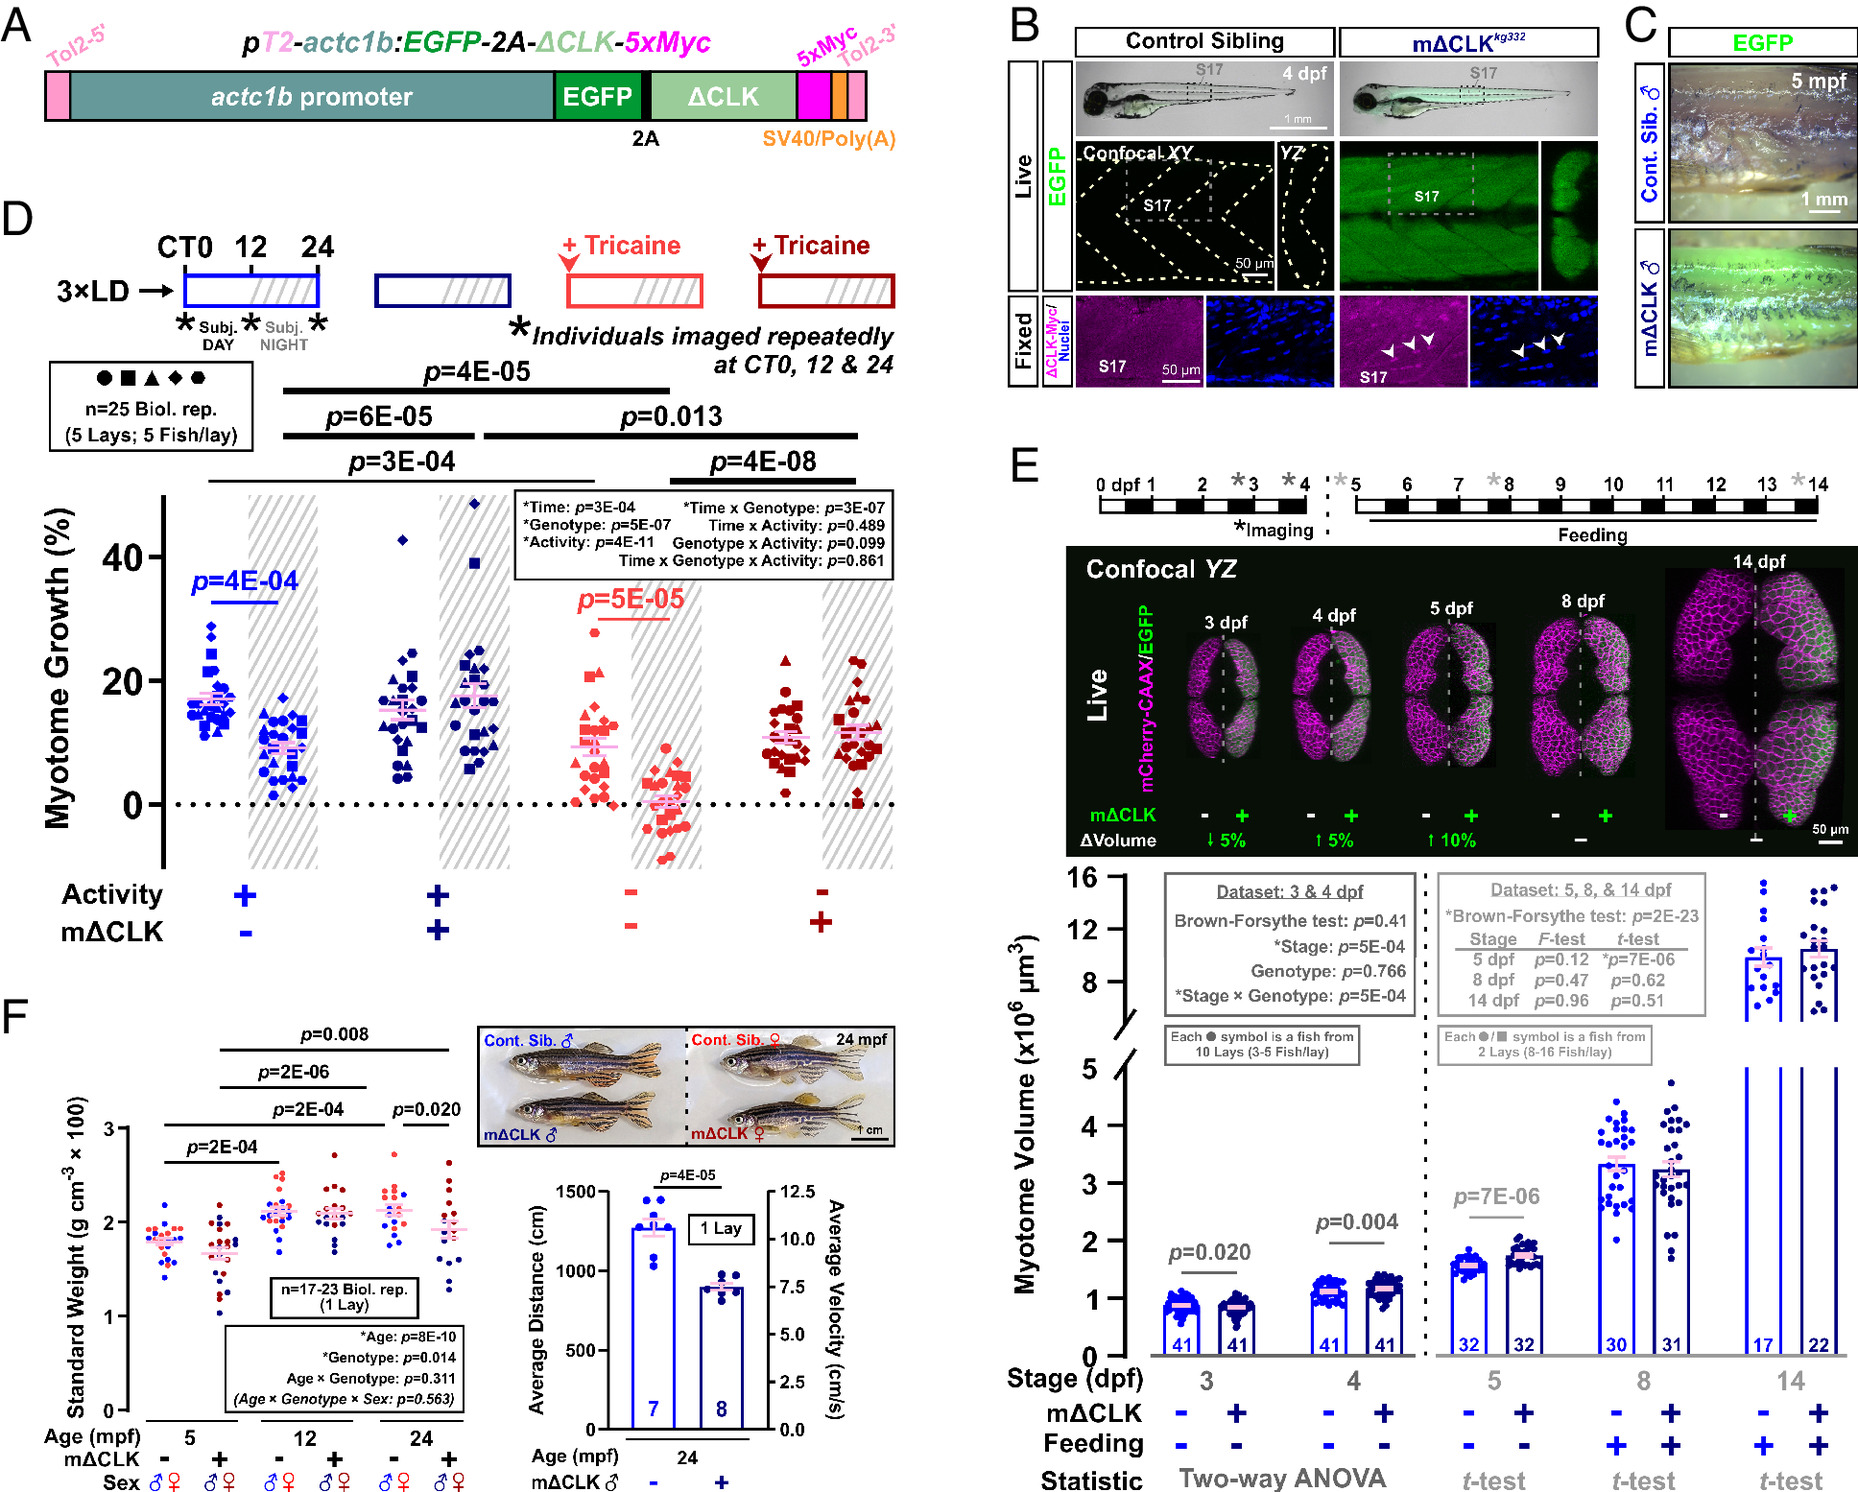
Fig. 1 Inhibition of the muscle peripheral clock disrupts muscle clock output and alters circadian muscle growth. (A) Design of the muscle-specific dominant negative clock (mΔCLK) construct. (B) Brightfield/EGFP overlay (top row) showing the gross morphology of control and mΔCLK siblings at 4 dpf. Confocal XY (parasagittal) and YZ (transverse) slices of trunk musculature (boxes) showing uniform EGFP (live; middle row) and Myc-tagged-ΔCLK in myonuclei counterstained with Hoechst 33342 (fixed; bottom row). Arrowheads indicate Myc-positive myonuclei. (C) Brightfield/EGFP overlay showing persistence of EGFP in skinned myotome of mΔCLK but none in control sibling (Cont. Sib.) fish at 5 mpf. (D) Circadian muscle growth of myotome 17 from 3 to 4 dpf (% change) measured with actc1b:mCherryCAAX in control and mΔCLK siblings. Muscle growth of individual larvae (3xLD entrained) was tracked every 12 h (*) under free-run conditions (constant light) between 3 and 4 dpf as shown in schematics. Sibling control (light color symbols in all Figures) and mΔCLK transgenic (dark color symbols) were either unanesthetized (active; blue symbols) or anesthetized (inactive, arrowhead; red symbols). CT is circadian time. CT0-12 and CT12-24 are subjective (subj.) day and night, respectively. Statistics are three-way ANOVA (Time/Treatment/Genotype) with Bonferroni’s post hoc test. (E) Myotome volume measured at 3, 4, 5, 8, and 14 dpf in control and mΔCLK siblings that were raised under LD. Single confocal YZ (transverse) slices show muscle cross-sectional area visualized with actc1b:mCherryCAAX without (Left) or with mΔCLK (right; EGFP marker). Schematic above shows imaging and feeding timeline; break indicates separate biological replicates at 3 and 4 dpf from 5, 8, and 14 dpf. Statistics are two-way ANOVA (Stage/Genotype) with Bonferroni’s post hoc test for the 3 and 4 dpf dataset, and unpaired t test for the individual 5, 8, and 14 dpf datasets (unequal variance shown with Brown–Forsythe and F-tests precluded ANOVA). (F) Brightfield images (Top) showing the gross morphology of control and mΔCLK siblings at 24 mpf. Standard weight of male (blue) and female (red) control and mΔCLK siblings, measured at 5, 12, and 24 mpf. Statistics are two-way ANOVA (Age/Genotype) and three-way ANOVA (Age/Genotype/Sex) with Bonferroni’s post hoc test. Average swimming distance and velocity measured at 24 mpf; statistics are unpaired t test.