
- Title
-
Brain accumulation of lactosylceramide characterizes GALC deficiency in a zebrafish model of Krabbe disease
- Authors
- Guerra, J., Belleri, M., Scalvini, E., Capoferri, D., Tobia, C., Ravelli, C., Corli, M., Bresciani, N., Casas, J., Fabrias, G., Dei Cas, M., Presta, M., Mignani, L.
- Source
- Full text @ Brain
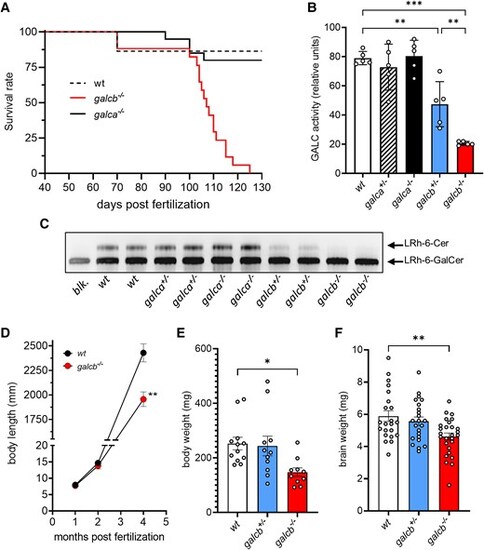
Characterization of galca and galcb knockout zebrafish. (A) Survival analysis of wild-type (WT), galca knockout (KO) and galcb KO zebrafish (n ≥ 17 animals/group). The survival of galca KO mutants and of heterozygous galca+/− and galcb+/− animals (not shown) was not significantly different for WT siblings [Log-rank (Mantel-Coz) test]. (B) GALC enzymatic activity thin-layer chromatography (TLC) assay of the brain extracts of zebrafish mutants at 4 mpf (five animals/group). (C) Representative image of a TLC assay showing the GALC activity of the brain extracts of two animals for each experimental group. (D) Body length of WT and galcb KO zebrafish measured at different times of growth. The rate of growth of galca+/−, galca−/− and galcb+/− animals was not significantly different from WT siblings (not shown). At the end stage of disease (4 months post fertilization), body weight (E) and the weight of harvested brain (F) were measured for the indicated WT, galcb+/−, and galcb−/− animals. Data are the mean ± standard error of the mean. One-way ANOVA (Tukey's multiple comparison test) in B and F; Student's t-test in D: *P < 0.05, **P < 0.01, ***P < 0.001. |
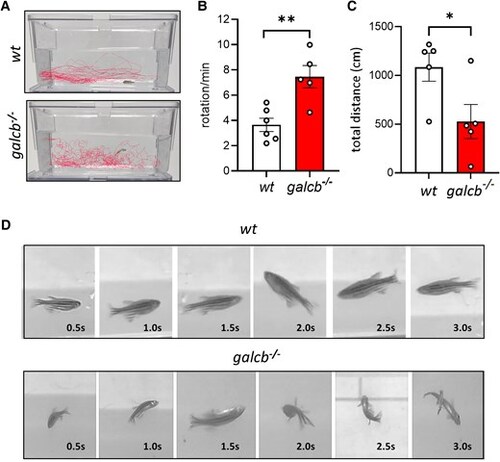
Galcb knockout zebrafish exhibits impaired locomotion behaviour. (A) Representative swim behaviour tracking for wild-type (WT) and galcb knockout (KO) zebrafish at 4 months post fertilization (mpf). Alterations of fish locomotion of galcb KO mutants versus WT siblings was recorded for 5 min from the side view of the tank and quantified by measuring the number of body rotation/min (B) and total distance moved (C) using the Ethovision software equipped with a colour camera (five animals/group). Data are the mean ± standard error of the mean. Student's t-test: *P < 0.05, **P < 0.01. (D) Time frame images from Supplementary Video 1 showing the swim behaviour of WT and galcb KO zebrafish at 4 mpf. |
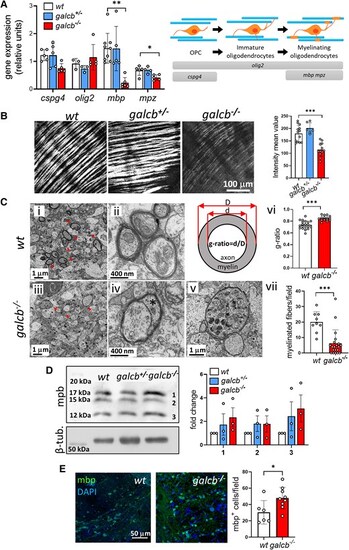
Brain demyelination in galcb knockout zebrafish. (A) RT-qPCR analysis of the expression of oligodendrocyte (OL) and myelin marker genes cspg4, olig2, mbp and mpz in the brain of wild-type (WT), galcb+/− and galcb−/− zebrafish at 4 months post fertilization (mpf). For each gene, the data were normalized to its expression in one WT animal. Data are the mean ± standard deviation (SD) of 3–5 animals per group. Right: Schematic representation of OL differentiation and relative gene markers. (B) Spectral confocal reflectance microscopy analysis of the optic tectum of WT, galcb+/− and galcb−/− zebrafish at 4 mpf. Similar results were obtained in three animals per group. Right: Quantification of the myelin signal intensity in ≥ 6 microscopic fields/group. (C) Transmission electron microscopy analysis of the diencephalon of WT siblings (i and ii) compared with galcb knockout mutants (iii–v). Myelin structural alterations, thinner myelin sheets and degenerated axons characterized by cytoplasmatic accumulation of mitochondria and lysosomes are detectable in galcb−/− mutants. [C(vi)] g-Ratio was calculated for five myelin fibres in 3–4 microscopic fields. [C(vii)] Myelinated fibres (arrowheads) were counted in >10 microscopic fields/group. (D) Western blot analysis of mbp protein levels in the brain extracts of WT, galcb+/− and galcb−/− zebrafish at 4 mpf. β-tubulin was used as loading control. Right: Quantification of the three immunoreactive mbp protein bands does not show any statistical difference among the three experimental groups (data are from three independent experiments). (E) Immunofluorescence analysis shows the presence of numerous mbp-positive cells in the brain of galcb−/− zebrafish at 4 mpf. 4′,6-diamidino-2-phenylindole (DAPI) was used for nuclear counterstaining. Right: Quantification of mbp signal intensity in ≥6 microscopic fields/group. Data are the mean ± SD. One-way ANOVA (Tukey's multiple comparison test) in A, B and D; Student's t-test in C and E: *P < 0.05, **P < 0.01, ***P < 0.001. OPC = oligodendrocyte precursor cell; RT-qPCR = reverse transcriptase-quantitative PCR. |
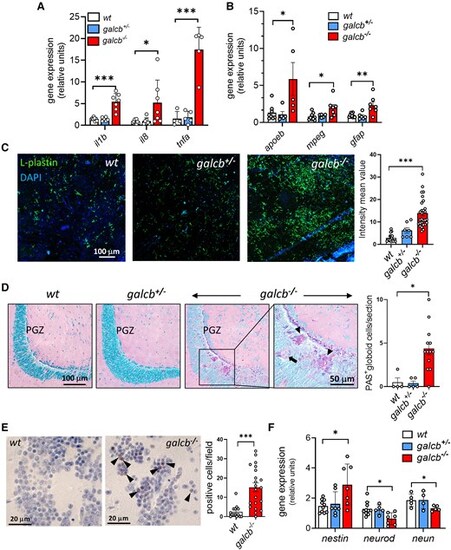
Brain neuroinflammation and neurodegeneration in galcb knockout zebrafish. (A and B) RT-qPCR analysis of the expression of neuroinflammation-related genes interleukin-1b (il1b), il8, tumor necrosis factor-a (tnfa), apolipoprotein Eb (apoeb), macrophage expressed 1 (mpeg1) and glial fibrillary acidic protein (gfap) in the brain of wild-type (WT), galcb+/− and galcb−/− zebrafish at 4 months post fertilization (mpf). For each gene, the data were normalized to its expression in one WT animal. Data are the mean ± standard deviation of 5–7 animals per group. (C) Immunofluorescence analysis shows the presence of numerous L-plastin-positive cells in the brain of galcb−/− zebrafish at 4 mpf, absent in WT and galcb+/−siblings. 4′,6-diamidino-2-phenylindole (DAPI) was used for nuclear counterstaining. Right: Quantification of L-plastin signal intensity in ≥7 microscopic fields/group. (D) Periodic acid–Schiff (PAS) staining shows the presence of globoid cells (arrows) in the periventricular grey zone (PGZ) of the brain of galcb−/− zebrafish at 4 mpf, absent in WT and galcb+/−siblings. The number of PAS-positive globoid cells were counted in ≥4 microscopic sections/group. (E) Immunohistochemical analysis shows the increase of cleaved caspase3-positive cells in the brain of galcb−/− zebrafish at 4 mpf compared with WT siblings. The number of cleaved caspase3-positive cells were counted in at least 14 microscopic fields/group. (F) RT-qPCR analysis of the expression of neuronal marker genes nestin, neuronal differentiation 1 (neurod1) and RNA binding fox-1 homolog 3a (neun) in the brain of WT, galcb+/− and galcb−/− zebrafish at 4 mpf. For each gene, the data were normalized to its expression in one WT animal (n > 4 animals/group). Data are the mean ± standard deviation. One-way ANOVA (Tukey's multiple comparison test): *P < 0.05, **P < 0.01, ***P < 0.001. RT-qPCR = reverse transcriptase-quantitative PCR. |
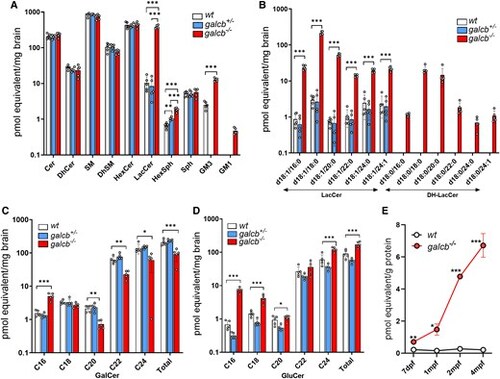
Targeted sphingolipid analysis of the brain of galcb knockout zebrafish. The targeted sphingolipid analysis of the brain of wild-type (WT), galcb+/− and galcb−/− zebrafish was performed for the indicated lipid classes at 4 months post fertilization (mpf). (A) Levels of the different sphingolipid classes as sum of all the species analysed. (B) Levels of the different LacCer and DH-LacCer species. LacCer = lactosylceramide. (C and D) Levels of GalCer and GluCer species. Data are the mean ± standard error of the mean of five animals per group. One-way ANOVA (Tukey's multiple comparison test): *P < 0.05, **P < 0.01, ***P < 0.001. Cer = ceramide; DH-Cer = dihydro-Cer; SM = sphingomyelin; DH-SM = dihydro-SM; HexCer = hexosylceramide; Sph = sphingosine; HexSph = hexoxylsphingosine. (E) Levels of LacCer at different developmental stages in WT and galcb−/− animals. Data are the mean ± standard error of the mean. Student's t-test: *P < 0.05, **P < 0.01, ***P < 0.001. |
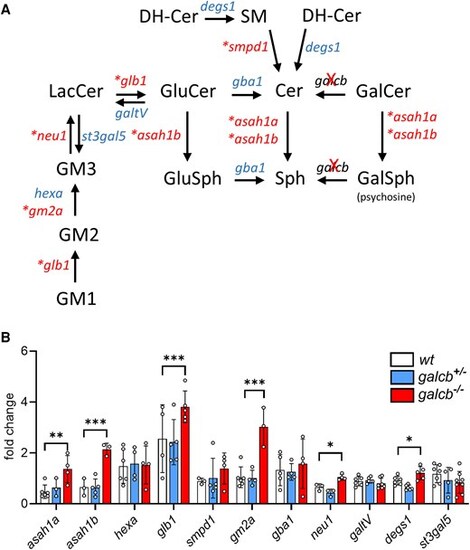
Expression of enzymes involved in LacCer/cer metabolism in the brain of galcb knockout zebrafish. (A) Schematic representation of major metabolic pathways involved in LacCer/Cer metabolism. (B) The expression of the indicated genes has been assessed by RT-qPCR in the brain of wild-type (WT) and galcb knockout (KO) mutants at 4 months post fertilization. For each gene, the data were normalized to its expression in one WT animal. Data are the mean ± standard deviation of 4–6 animals per group. One-way ANOVA (Tukey's multiple comparison test): *P < 0.05, **P < 0.01, ***P < 0.001. In A, enzymes exhibiting upregulated gene expression in brains of galcb KO animals are marked by asterisks. LacCer = lactosylceramide; RT-qPCR = reverse transcriptase-quantitative PCR. |
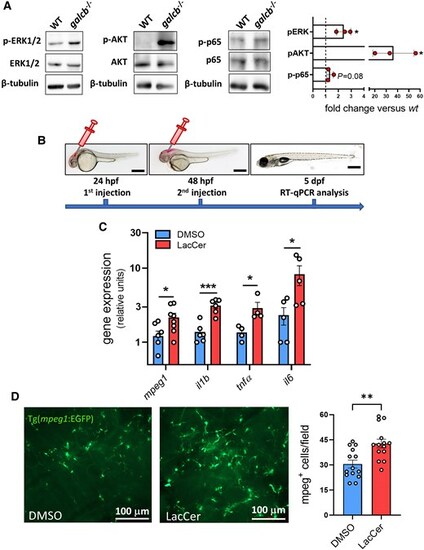
LacCer induces a proinflammatory phenotype in zebrafish brain. (A) Western blot analysis of ERK1/2, AKT and p65 phosphorylation in the brain of wild-type (WT) and galcb knockout (KO) zebrafish showing the activation of signalling pathways associated to LacCer accumulation in galcb KO zebrafish at 4 months post fertilization. Right: Quantification of immunoreactive bands obtained in three independent experiments. (B) Schematic of the experimental procedure for intraventricular injection of GalCer in zebrafish embryos. (C) RT-qPCR analysis of the expression levels of the inflammatory markers interleukin-1b (il1b), tumor necrosis factor-a (tnfa), il6 and macrophage expressed 1 (mpeg1) following a double intraventricular injection of 0.4 ng of LacCer in the brain of WT zebrafish embryos. For each gene, the data were normalized to its expression in one dimethyl sulfoxide (DMSO)-injected animal. Data are the mean ± standard error of the mean of 4–6 pools of 7 embryos per group. Scale bars: 500 μm. Student's t-test: *P < 0.05, **P < 0.01. (D) Fluorescent microscopic analysis following double injection of 0.4 ng DMSO or LacCer in the brain ventriculus of Tg(mpeg1:EGFP) zebrafish embryos shows a significant infiltration of mpeg1-positive macrophages in LacCer injected brains. Right: Quantification of mpeg1-positive cells in harvested brains. Data are the mean ± standard error of the mean of ≥3 microscopic fields per animals (n = 4). Scale bars: 100 μm. Student's t-test: **P < 0.01. LacCer = lactosylceramide; RT-qPCR = reverse transcriptase-quantitative PCR. |