
- Title
-
Socs3a is Dispensable for Zebrafish Hematopoiesis and is Required for Neuromast Formation
- Authors
- Sobah, M.L., Liongue, C., Ward, A.C.
- Source
- Full text @ Front Biosci (Landmark Ed)

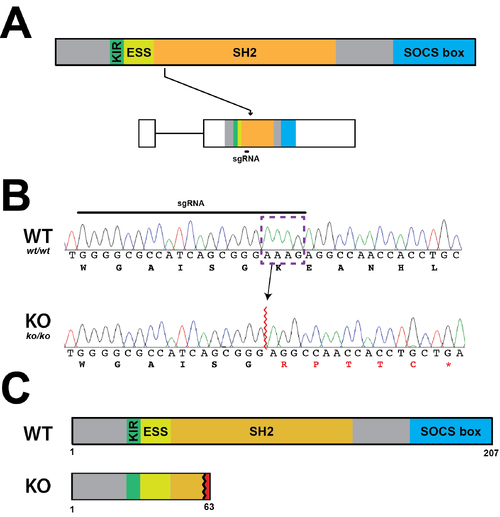
Establishment of a Socs3a KO line. (A) Schematic diagram of the Socs3a protein indicating constituent domains (KIR, kinase inhibitory region; ESS, extended SH2 sub-domain; SH2, Src homology 2 domain; SOCS box, suppressor of cytokine signaling box) as well as socs3a gene showing the intron (thin line) and exons (boxes) and sequences coding each domain and targeted with the sgRNAs. (B) Sequence traces of representative homozygous wildtype (WT, socs3awt/wt) and knockout (KO, socs3ako/ko) fish at the genomic region targeted by the sgRNA showing nucleotides and encoded amino acids. Nucleotide sequences that were deleted in the mutant are boxed purple, with de novo protein sequences shown in red. (C) Schematic of Socs3a protein forms in WT and KO fish. |
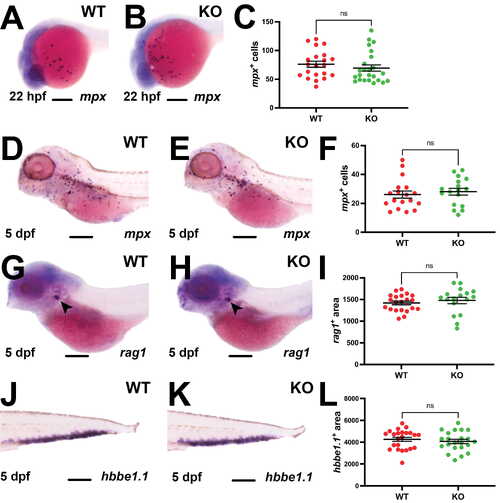
Effect of Socs3a ablation on the early stages of hematopoiesis. (A,B,D,E,G,H,J,K) Representative images of wildtype (WT) and Socs3a knockout (KO) embryos analyzed using WISH with mpx at 22 hpf (A,B) and 5 dpf (D,E), as well as rag1 (G,H) and hbbe1.1 (J,K) at 5 dpf, focusing on the main areas of staining for each, including 200 µm scale bars. (C,F,I,L) Quantitation of mpx+ cells at 22 hpf (C) and 5 dpf (F) and area of staining for rag1 for (I) and (L) hbbe1.1 at 5 dpf displaying individual embryos and mean ± SEM, with level of statistical significance indicated (ns, not significant; n = 17–24). |
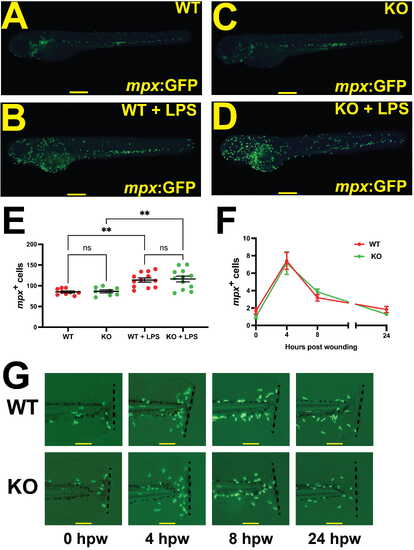
Impact of Socs3a ablation on emergency granulopoiesis and neutrophil function. (A–E) Socs3a wildtype (WT) and knockout (KO) embryos on a Tg(mpx:GFP) background were injected with LPS (+LPS) at 3 dpf and imaged 8 hours later showing (A–D) representative images and (E) quantitation of total mpx+ cells. (F,G) Embryos were separately inflicted with a tailfin wound at 3 dpf, with the caudal fin imaged at 4 h time points from 0 to 24 hours post wounding, with representative images (G) and quantification of (F) the mpx+ cells present at the site of wounding shown. Scale bars of 100 µm are shown for (A–D,G), with the mean ± SEM and statistical significance shown for (E,F) (** p < 0.01; ns, not significant; n = 8–12). |
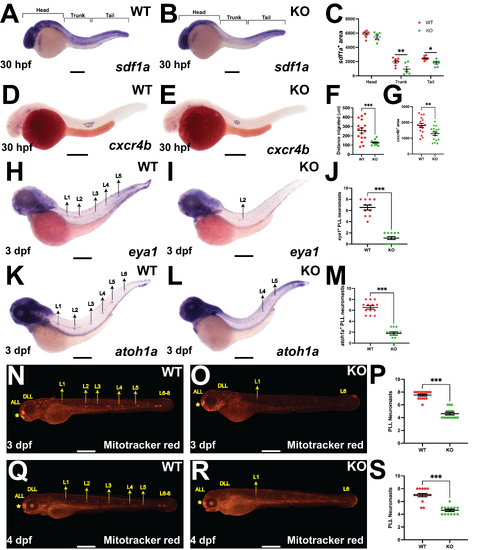
Effect of Socs3a ablation on posterior lateral line neuromast formation. (A,B,D,E,H,I,K,L,N,O,Q,R) Representative images of Socs3a wildtype (WT) and knockout (KO) embryos analyzed using WISH with sdf1a (A,B) and cxcr4b (D,E) at 30 hpf, and eya1 (H,I) and atoh1a (K,L) at 3 dpf or stained with Mitotracker red, allowing visualization of posterior lateral line (PLL) neuromasts L1-8 at 3 dpf (N,O) and 4 dpf (Q,R), with scale bars of 100 µm shown. (C,F,G,J,M,P,S) Quantification of the area of sdf1a staining in the head, trunk and tail as described [31] (C), distance traveled by cxcr4b+ primordia (F), area of cxcr4b+ primordia (G), and number of eya1+ (J), atoh1a+ (M) or Mitotracker red stained (P,S) neuromasts, showing individual points along with the mean ± SEM and statistical significance (*** p < 0.001, ** p < 0.01, * p < 0.05; n = 10–15). |
Analysis of potential pathway components. (A–C) Representative images of wildtype (WT), Socs3b knockout (Socs3b KO) and Stat3 knockout (Stat3 KO) embryos analyzed with Mitotracker red at 3 dpf, with scale bars of 100 µm shown. (D) Quantitation of PLL neuromasts, showing individual points along with the mean ± SEM. No statistically significant differences were observed between groups (n = 14–16, repeated twice). (E) RT-PCR analysis of the indicated genes in WT, Socs3a KO and Socs3b KO embryos at 3 dpf |