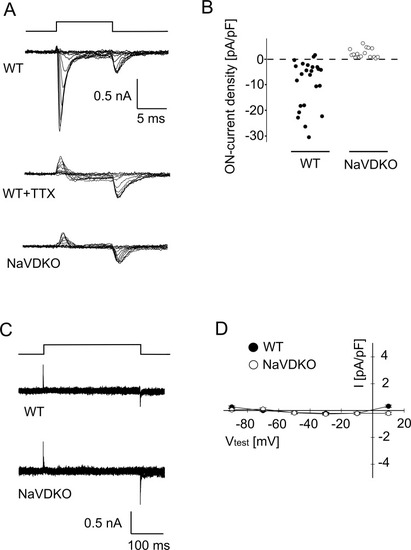
Electrophysiology of isolated myocytes.

(A) Representative sodium current of WT (upper panel), WT in the presence of 1 μM TTX (middle panel) and NaVDKO (lower panel) myocytes. Top panel indicates the timing of the depolarization pulse. Traces evoked by voltages ranging from −90 to 20 mV in 10 mV increments are superimposed. (B) Comparison of the peak ON-current density between WT and NaVDKO myocytes. Currents were recorded from myocytes at 3–6 days post fertilization (dpf). (C) Representative calcium current recordings from isolated myocytes. Top panel indicates the timing of the test pulse. Traces evoked by voltages ranging from −90 mV to 10 mV in 20 mV increments are superimposed. (D) Current–voltage relationship of the calcium current recording. Average current amplitudes 100–102 ms after the onset of the test pulse were plotted against potentials. Data were shown as mean ± SEM (n = 6 for both WT and NaVDKO). The numerical data presented in this figure can be found in S1 Data.

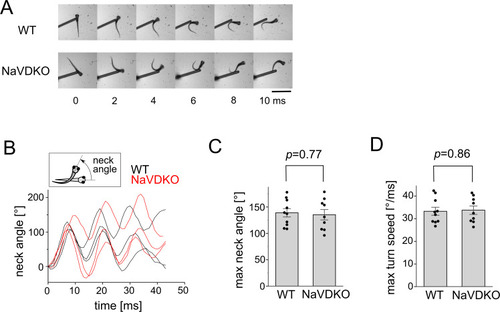
Escape response of WT and NaVDKO zebrafish.

(A) Snapshots of the representative escape responses of WT (upper) and NaVDKO (lower) zebrafish at 4 dpf in normal water. Images were captured every 2 ms. Scale bar: 1 mm. (B) Representative plots of the “neck angle” during the escape behavior of WT and NaVDKO fish. The inset shows the definition of “neck angle.” (C) Analysis of the maximum neck angle in the first turn of 4 dpf fish. Individual data points are shown as dots. Bars and error bars represent the mean and SEM, respectively (n = 10 for WT, n = 9 for NaVDKO). (D) Analysis of the maximum turn angle speed of 4 dpf fish. The maximum turn angle speed was calculated from the differential of the neck angle (n = 10 for WT, n = 9 for NaVDKO). The numerical data presented in this figure can be found in S1 Data.

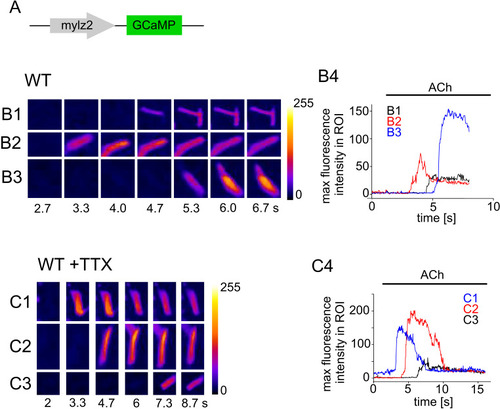
Ca2+ imaging of isolated myocytes in the absence and presence of TTX.

(A) Expression of GCaMP7a was driven by the mylz2 promoter. (B1, B2, and B3) Representative Ca2+ imaging of WT myocytes at 3 dpf embryos. Numbers below the images indicate time from the beginning of the recording. Fluorescent intensity is shown in color. (B4) Maximum fluorescence intensity in the region of interest (ROI) (B1, B2 and B3) was plotted against time. (C1, C2, and C3) Ca2+ imaging of WT myocytes at 5 dpf in the presence of 1 μM TTX. (C4) Maximum fluorescence intensity of ROI shown in C1, C2 and C3 were plotted against time. The numerical data presented in this figure can be found in S1 Data.

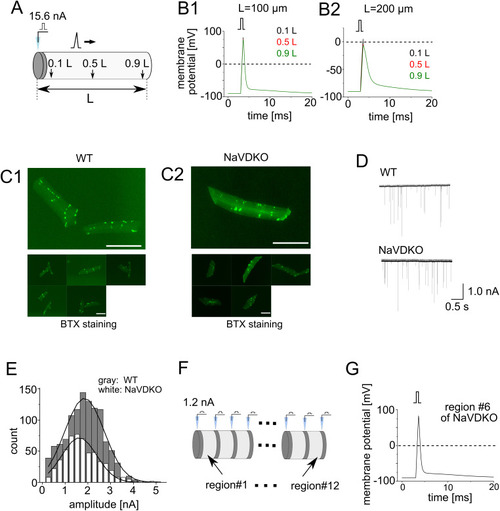
Mathematical simulation of depolarization in embryonic myocytes.

(A) A single synapse model with a length of L. The ACh release site was modeled as a 1 μm-long cylinder (dark gray). The current was injected at the ACh release site and potentials at 0.1, 0.5, and 0.9 L away from the ACh release site were calculated. (B) Membrane potentials for L = 100 (B1) and 200 μm (B2). Potentials at 0.1, 0.5, and 0.9 L from the ACh release site were calculated. Three colored traces (0.1, 0.5, and 0.9 L) overlapped. Square pulses above the plots indicate the timing of the synaptic input. (C) BTX staining of myofibers in 4 and 6 dpf fish. Myofibers were from WT (C1) and NaVDKO (C2) fish. Upper panels show magnified views. Scale bars: 50 μm. (D) Representative miniature end-plate currents (mEPC) of WT (left) and NaVDKO (right). (E) Representative histogram of the mEPC amplitude in WT (dark gray) and NaVDKO (light gray). The curves were fit to a Gaussian function. (F) Geometry of the multiple-synapse model. Thirteen 1 μm-long cylinders (dark gray) and 12 7 μm-long cylinders (light gray) were placed alternately. Synaptic currents were injected into individual ACh release sites. The 7 μm-long cylinders are designated as region #1 through #12. (G) Potentials at the center of region #6. The numerical data presented in this figure can be found in S1 Data.

Acknowledgments
This image is the copyrighted work of the attributed author or publisher, and ZFIN has permission only to display this image to its users. Additional permissions should be obtained from the applicable author or publisher of the image. Full text @ PLoS Biol.