IMAGE

Fig 3

ID
ZDB-IMAGE-250426-31
Source
Figures for Akiyama et al., 2025
Image
Figure Caption

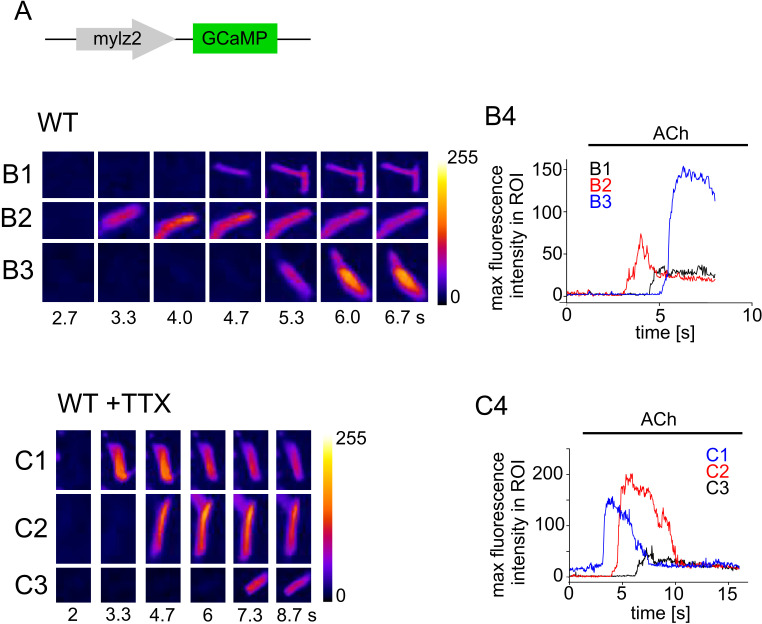
Fig 3 Ca2+ imaging of isolated myocytes in the absence and presence of TTX.

(A) Expression of GCaMP7a was driven by the mylz2 promoter. (B1, B2, and B3) Representative Ca2+ imaging of WT myocytes at 3 dpf embryos. Numbers below the images indicate time from the beginning of the recording. Fluorescent intensity is shown in color. (B4) Maximum fluorescence intensity in the region of interest (ROI) (B1, B2 and B3) was plotted against time. (C1, C2, and C3) Ca2+ imaging of WT myocytes at 5 dpf in the presence of 1 μM TTX. (C4) Maximum fluorescence intensity of ROI shown in C1, C2 and C3 were plotted against time. The numerical data presented in this figure can be found in S1 Data.

Acknowledgments
This image is the copyrighted work of the attributed author or publisher, and ZFIN has permission only to display this image to its users. Additional permissions should be obtained from the applicable author or publisher of the image. Full text @ PLoS Biol.