|
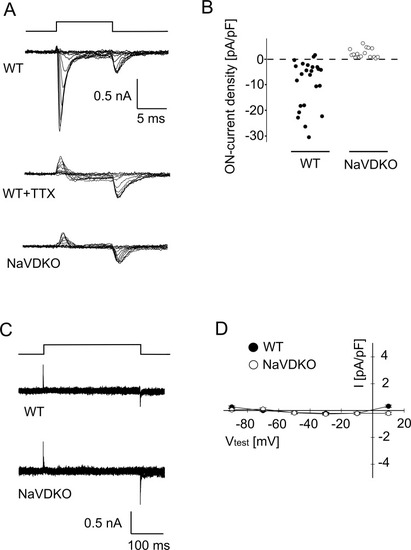
Electrophysiology of isolated myocytes. (A) Representative sodium current of WT (upper panel), WT in the presence of 1 μM TTX (middle panel) and NaVDKO (lower panel) myocytes. Top panel indicates the timing of the depolarization pulse. Traces evoked by voltages ranging from −90 to 20 mV in 10 mV increments are superimposed. (B) Comparison of the peak ON-current density between WT and NaVDKO myocytes. Currents were recorded from myocytes at 3–6 days post fertilization (dpf). (C) Representative calcium current recordings from isolated myocytes. Top panel indicates the timing of the test pulse. Traces evoked by voltages ranging from −90 mV to 10 mV in 20 mV increments are superimposed. (D) Current–voltage relationship of the calcium current recording. Average current amplitudes 100–102 ms after the onset of the test pulse were plotted against potentials. Data were shown as mean ± SEM (n = 6 for both WT and NaVDKO). The numerical data presented in this figure can be found in S1 Data.
|