IMAGE

Fig 4

ID
ZDB-IMAGE-250426-33
Source
Figures for Akiyama et al., 2025
Image
Figure Caption

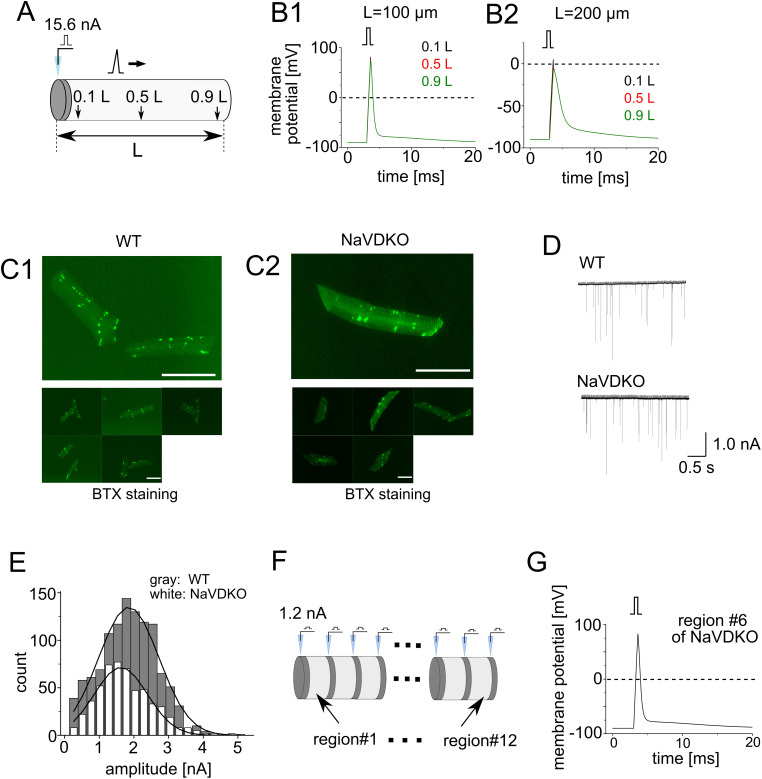
Fig 4 Mathematical simulation of depolarization in embryonic myocytes.

(A) A single synapse model with a length of L. The ACh release site was modeled as a 1 μm-long cylinder (dark gray). The current was injected at the ACh release site and potentials at 0.1, 0.5, and 0.9 L away from the ACh release site were calculated. (B) Membrane potentials for L = 100 (B1) and 200 μm (B2). Potentials at 0.1, 0.5, and 0.9 L from the ACh release site were calculated. Three colored traces (0.1, 0.5, and 0.9 L) overlapped. Square pulses above the plots indicate the timing of the synaptic input. (C) BTX staining of myofibers in 4 and 6 dpf fish. Myofibers were from WT (C1) and NaVDKO (C2) fish. Upper panels show magnified views. Scale bars: 50 μm. (D) Representative miniature end-plate currents (mEPC) of WT (left) and NaVDKO (right). (E) Representative histogram of the mEPC amplitude in WT (dark gray) and NaVDKO (light gray). The curves were fit to a Gaussian function. (F) Geometry of the multiple-synapse model. Thirteen 1 μm-long cylinders (dark gray) and 12 7 μm-long cylinders (light gray) were placed alternately. Synaptic currents were injected into individual ACh release sites. The 7 μm-long cylinders are designated as region #1 through #12. (G) Potentials at the center of region #6. The numerical data presented in this figure can be found in S1 Data.

Acknowledgments
This image is the copyrighted work of the attributed author or publisher, and ZFIN has permission only to display this image to its users. Additional permissions should be obtained from the applicable author or publisher of the image. Full text @ PLoS Biol.