
- Title
-
Cryo-EM structure of the BLOC-3 complex provides insights into the pathogenesis of Hermansky-Pudlak syndrome
- Authors
- Yong, X., Jia, G., Yang, Q., Zhou, C., Zhang, S., Deng, H., Billadeau, D.D., Su, Z., Jia, D.
- Source
- Full text @ Nat. Commun.
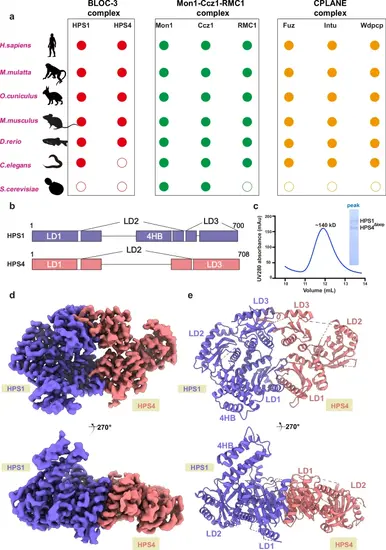
Cryo-EM structure of the BLOC-3 complex. a Cartoon representation incorporating the results of multiple phylogenetic analyses, including subunits from BLOC-3, Mon1-Ccz1-RMC1, and CPLANE, respectively. b Schematic domain organization of human BLOC-3 subunits. Longin domains (LD1 to LD3) and four-helical bundle domains (4HB) are indicated. c Gel filtration profile of the BLOC-3 complex. The horizontal axis represents elution volume, and the vertical axis represents ultraviolet (UV) absorption. The peak and estimated molecular mass of targeted proteins are labeled. The Coomassie blue-stained gel shows the peak fraction of HPS1-HPS4Δloop from gel filtration. d, e Two views of the cryo-EM density (left) and model (right) of the BLOC-3 complex. HPS1 is shown in purple, and HPS4 in pink. The bottom view is a 270° rotation along the horizontal axis of the top view. |
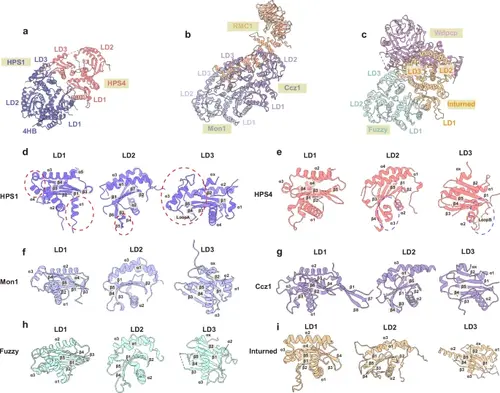
Structural comparison of BLOC-3, Mon1-Ccz1-RMC1 and CPLANE.a–c Cyro-EM structures of BLOC-3, Mon1-Ccz1-RMC1 (PDB: 8JBE), and CPLANE (PDB: 7Q3D). d–i Closeup view of the LD domains from TLD RabGEF proteins. Secondary structures of TLD RabGEF proteins are labeled as indicated. The unique structures of LD domains from HPS1 and HPS4 are highlighted in circles. |
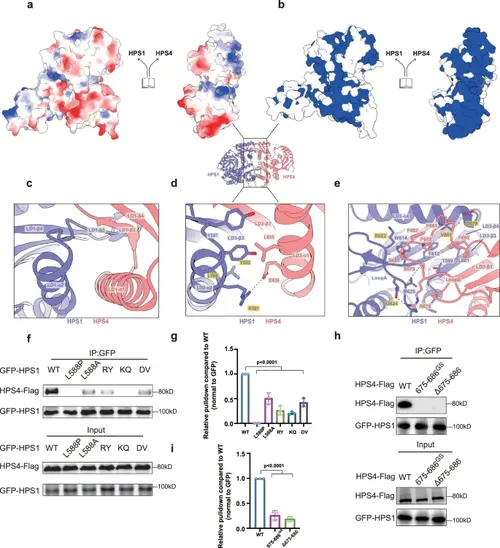
Comparative structural analysis reveals divergent assembly mechanisms of the BLOC-3 complex and other TLD RabGEFs.a, b Close-up views of the HPS1-HPS4 heterodimer interface illustrating electrostatic surface potential and conserved amino-acid residues (blue color represents conserved residues, while white color denotes non-conserved residues). c–e Detailed interactions of the interfaces between HPS1 (purple) and HPS4 (pink). Secondary structures of HPS1 and HPS4 are labeled as indicated. Residues critical for stabilizing the interface are shown in sticks. Black dashed lines indicate hydrogen bonds or salt bridges. Residues that are mutated in (f) are indicated with a yellow box. (f) HEK293T cells were transfected with Flag-tagged HPS4 and GFP-tagged HPS1 WT, L588P, L588A, R591E/Y592A(RY), K622E/Q624A(KQ), or D678R/V681A(DV) mutants, and subjected to GFP-nanotrap for immunoprecipitation. HPS1 and HPS4 were detected via antibodies against GFP and Flag, respectively. g Quantification of the results presented in (f). Statistical difference was determined by One-way ANOVA. Error bars represent the standard deviation of three independent biological repeats. n = 3. h HEK293T cells were transfected with GFP-tagged HPS1 and Flag-tagged HPS4 WT, 675-686GS or Δ675-686 mutant, and subjected to GFP-nanotrap for immunoprecipitation. HPS1 and HPS4 were detected via antibodies against GFP and Flag, respectively. (i) Quantification of the results presented in (h). Statistical difference was determined by One-way ANOVA. Error bars represent the standard deviation of three independent biological repeats. n = 3. |
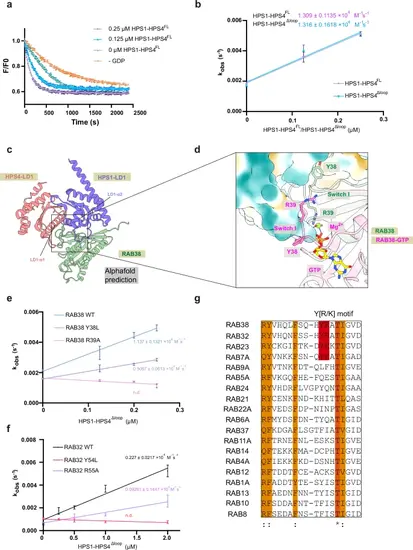
The conserved “Y[R/K]” motif in Rab GTPase switch I is required for their activation by TLD RabGEFs.a 2 μM Mant-GDP-loaded GST-tagged RAB38 was added, and nucleotide exchange was triggered by adding 200 μM GDP and 0, 0.125, or 0.25 μM GEF complex. The decrease of fluorescence was measured over time and normalized to fluorescence prior to GEF addition. Error bars represent the standard error of the mean (SEM) from three technical replicates. n = 3. b Nucleotide exchange rates of HPS1-HPS4FL and HPS1-HPS4Δloop are plotted against the concentration of HPS1-HPS4, and the catalytic efficiency (kcat/KM) in M−1s−1 was determined as the slope of the linear fit to the equation y = A*x + B. Error bars represent the SEM of three independent biological repeats. The catalytic efficiency (kcat/KM) of HPS1-HPS4FL and HPS1-HPS4Δloop is shown. n = 3. c Identification of the putative RAB32/38 binding site in BLOC-3. Model of the respective LD1 domain of HPS1 (purple) and HPS4 (pink), and RAB38 (green) complex based on an AlphaFold2 prediction. (d A zoom-in view of the HPS1-HPS4-RAB38 binding site superposed with the crystal structure of RAB38-GTP (magenta, PDB: 6hdu). HPS1 and HPS4 are shown in hydrophobic surface potential, and Y38 and R39 of RAB38 are shown in sticks. The predicted model is colored as in (c). e, f Nucleotide exchange rates of RAB38 and RAB32 are plotted against the concentration of HPS1-HPS4, and the catalytic efficiency (kcat/KM) in M−1s−1 was determined as the slope of the linear fit to the equation y = A*x + B. Error bars represent the SEM of three independent biological repeats. The catalytic efficiency (kcat/KM) of HPS1-HPS4Δloop towards RAB32, RAB38, and indicated mutants is shown. N.d., not determined. n = 3. g Sequence alignment of the switch I regions of Rab GTPases. The Y[R/K] motif is highlighted in red, with * indicating highly conserved residues and: representing residues that are moderately conserved. |
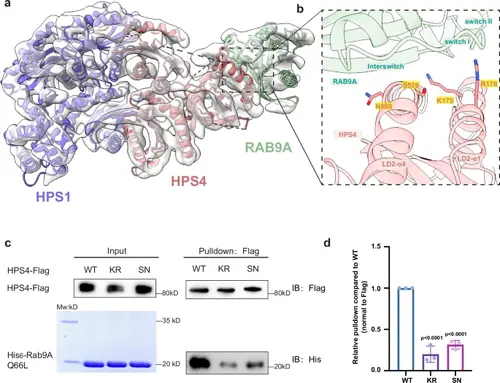
The interaction between BLOC-3 and RAB9A.a Low-resolution cryoEM envelope of BLOC-3-Rab9A Q66L with docked AlphaFold3 model. b Close-up view of the HPS4-RAB9A binding interface, with critical residues for RAB9A binding shown in sticks. Residues that are mutated in (d) are indicated with a yellow box. c Flag-tagged HPS4 WT and mutants were expressed and purified using HEK293T cells, then incubated with purified His-tagged mouse Rab9A Q66L mutant and subjected to Flag pull-down. HPS4 and Rab9A were detected by antibodies against Flag and His, respectively. d Quantification of the results presented in (c). Statistical differences were determined by One-way ANOVA. Error bars represent the standard deviation of three independent biological repeats. n = 3. |
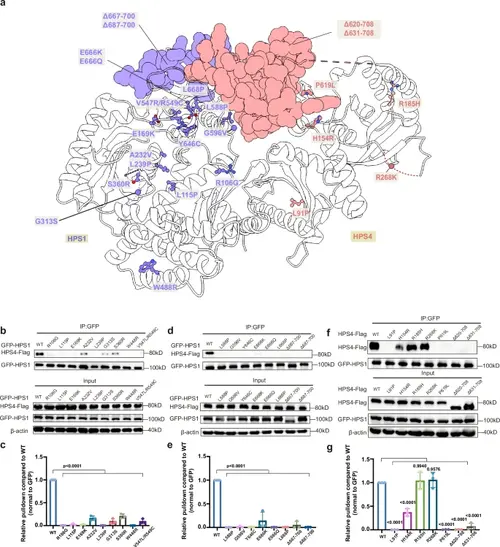
Structural mapping of the disease-related mutations and their effects on BLOC-3 assembly.a Structural mapping of the disease-associated mutations of BLOC-3. b–e Coimmunoprecipitation assays were used to assess the effects of the disease-associated mutations on the formation of BLOC-3. HPS1 mutation variants were cotransfected with Flag-tagged HPS4 in HEK293F cells, the cells were lysed and coimmunoprecipitated with anti-GFP affinity gel, and the purified samples and input samples were immunoblotted. Antibodies: anti-Flag (HPS4), anti-GFP (HPS1) and anti-β-Actin. (c) and (e) presented the quantification of the results presented in (b) and (d), respectively. Statistical differences were determined by One-way ANOVA. Error bars represent the standard deviation of three independent biological repeats. n = 3. f, g HPS4 mutation variants were cotransfected with GFP-tagged HPS1 in HEK293F cells, the cells were lysed and coimmunoprecipitated with anti-GFP affinity gel, and the purified samples and input samples were immunoblotted. Antibodies: anti-Flag (HPS4), anti-GFP (HPS1) and anti-β-Actin. (g) presented the quantification of the results presented in (f). Statistical differences were determined by One-way ANOVA. Error bars represent the standard deviation of three independent biological repeats. n = 3. |
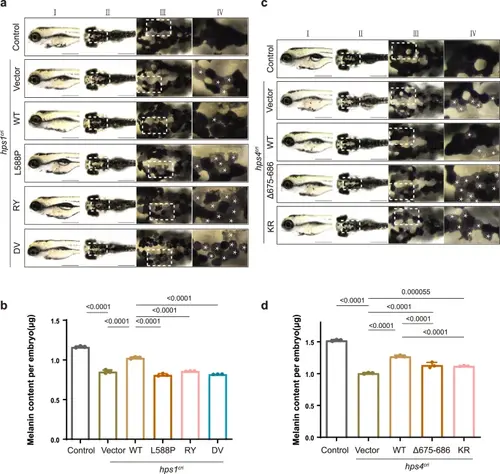
The interactions between HPS4 and HPS1 or RAB9A are critical for melanogenesis in zebrafisha Bright-field images of zebrafish at 96 h post-fertilization (hpf). Scale bar, 500 μm. Column I, lateral view; column II, dorsal view; column III, zoomed-in view, corresponds to the white box of column II; column IV, zoomed-in view, corresponds to the white box of column III. White asterisks (*) indicate the putative affected cells. b The total melanin levels of zebrafish at 96 hpf. Control: control ribonucleoprotein complex (RNP) injection (n = 35 embryos), hps1cri+vector: hps1-RNP and empty vector co-injection (n = 32 embryos), hps1cri + WT: hps1-RNP and human HPS1-WT CDS plasmids co-injection (n = 22 embryos), hps1cri + L588P: hps1-RNP and HPS1- L588P mutant CDS plasmids co-injection (n = 35 embryos), hps1cri + RY: hps1-RNP and HPS1-RY mutant CDS plasmids co-injection (n = 45 embryos), hps1cri + DV: hps1-RNP and HPS1-DV mutant CDS plasmids co-injection (n = 29 embryos). All injections were performed at the one-cell stage of development. Results were presented as mean ± SD. P-values were calculated using one-way ANOVA, Dunnett’s multiple comparisons test. Experiments were repeated 3 times. c Bright-field images of zebrafish at 96 hpf. Scale bar, 500 μm. Column I, lateral view; column II, dorsal view; column III, zoomed-in view, corresponds to the white box of column II; column IV, zoomed-in view, corresponds to the white box of column III. White asterisks (*) indicate the putative affected cells. d The total melanin levels of zebrafish at 96 hpf. Control: control ribonucleoprotein complex (RNP) injection (n = 40 embryos), hps4cri+vector: hps4-RNP and empty vector co-injection (n = 34 embryos), hps4cri + WT: hps4-RNP and human HPS4-WT CDS plasmids co-injection (n = 41 embryos), hps4cri + Δ675-686: hps4-RNP and HPS4 Δ675-686 mutant CDS plasmids co-injection (n = 30 embryos), hps4cri + KR: hps4-RNP and HPS4-KR mutant CDS plasmids co-injection (n = 25 embryos). All injections were performed at the one-cell stage of development. Results were presented as mean ± SD. P-values were calculated using one-way ANOVA, Dunnett’s multiple comparisons test. Experiments were repeated 3 times. PHENOTYPE:
|

ZFIN is incorporating published figure images and captions as part of an ongoing project. Figures from some publications have not yet been curated, or are not available for display because of copyright restrictions. PHENOTYPE:
|
|
ZFIN is incorporating published figure images and captions as part of an ongoing project. Figures from some publications have not yet been curated, or are not available for display because of copyright restrictions. PHENOTYPE:
|