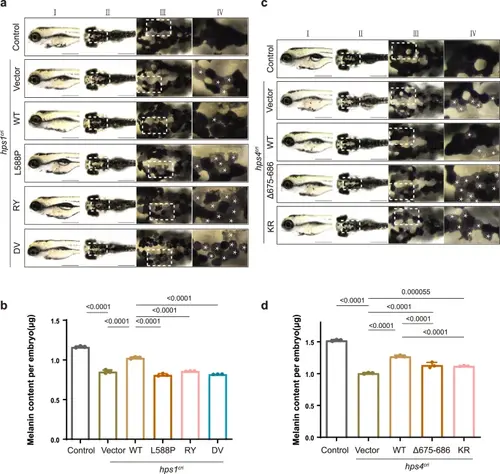
The interactions between HPS4 and HPS1 or RAB9A are critical for melanogenesis in zebrafisha Bright-field images of zebrafish at 96 h post-fertilization (hpf). Scale bar, 500 μm. Column I, lateral view; column II, dorsal view; column III, zoomed-in view, corresponds to the white box of column II; column IV, zoomed-in view, corresponds to the white box of column III. White asterisks (*) indicate the putative affected cells. b The total melanin levels of zebrafish at 96 hpf. Control: control ribonucleoprotein complex (RNP) injection (n = 35 embryos), hps1cri+vector: hps1-RNP and empty vector co-injection (n = 32 embryos), hps1cri + WT: hps1-RNP and human HPS1-WT CDS plasmids co-injection (n = 22 embryos), hps1cri + L588P: hps1-RNP and HPS1- L588P mutant CDS plasmids co-injection (n = 35 embryos), hps1cri + RY: hps1-RNP and HPS1-RY mutant CDS plasmids co-injection (n = 45 embryos), hps1cri + DV: hps1-RNP and HPS1-DV mutant CDS plasmids co-injection (n = 29 embryos). All injections were performed at the one-cell stage of development. Results were presented as mean ± SD. P-values were calculated using one-way ANOVA, Dunnett’s multiple comparisons test. Experiments were repeated 3 times. c Bright-field images of zebrafish at 96 hpf. Scale bar, 500 μm. Column I, lateral view; column II, dorsal view; column III, zoomed-in view, corresponds to the white box of column II; column IV, zoomed-in view, corresponds to the white box of column III. White asterisks (*) indicate the putative affected cells. d The total melanin levels of zebrafish at 96 hpf. Control: control ribonucleoprotein complex (RNP) injection (n = 40 embryos), hps4cri+vector: hps4-RNP and empty vector co-injection (n = 34 embryos), hps4cri + WT: hps4-RNP and human HPS4-WT CDS plasmids co-injection (n = 41 embryos), hps4cri + Δ675-686: hps4-RNP and HPS4 Δ675-686 mutant CDS plasmids co-injection (n = 30 embryos), hps4cri + KR: hps4-RNP and HPS4-KR mutant CDS plasmids co-injection (n = 25 embryos). All injections were performed at the one-cell stage of development. Results were presented as mean ± SD. P-values were calculated using one-way ANOVA, Dunnett’s multiple comparisons test. Experiments were repeated 3 times.
|
