
- Title
-
Characterization of a novel zebrafish model of MTMR5-associated Charcot-Marie-Tooth disease type 4B3
- Authors
- Lindzon, J., List, M., Geissah, S., Ariaz, A., Zhao, M., Dowling, J.J.
- Source
- Full text @ Brain Commun

|
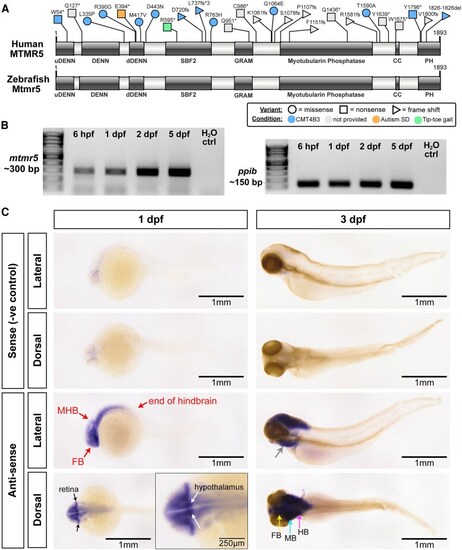
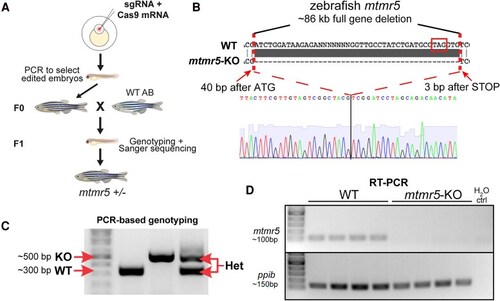
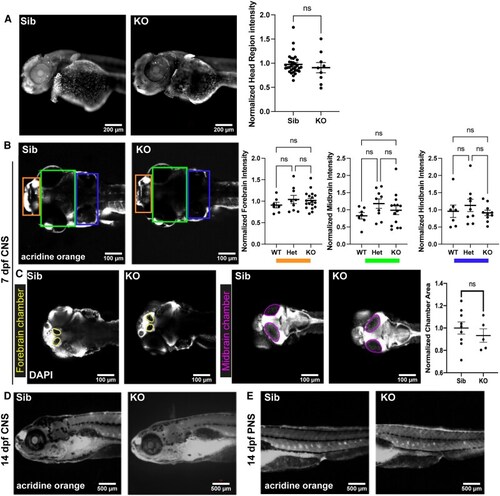
EXPRESSION / LABELING:
|
|
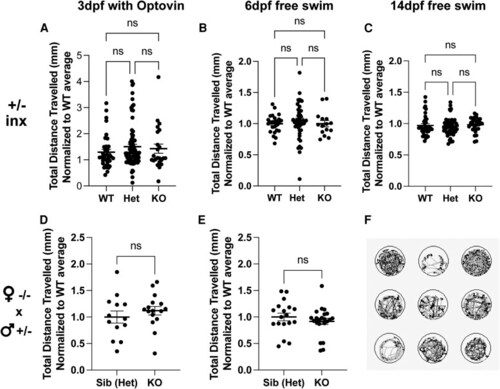
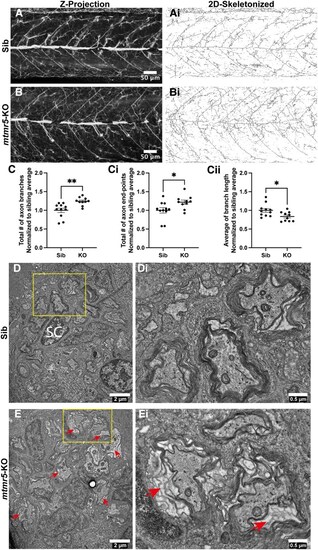
PHENOTYPE:
|
PHENOTYPE:
|
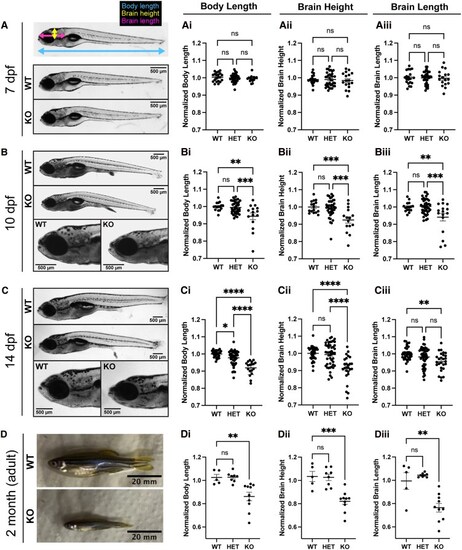
PHENOTYPE:
|
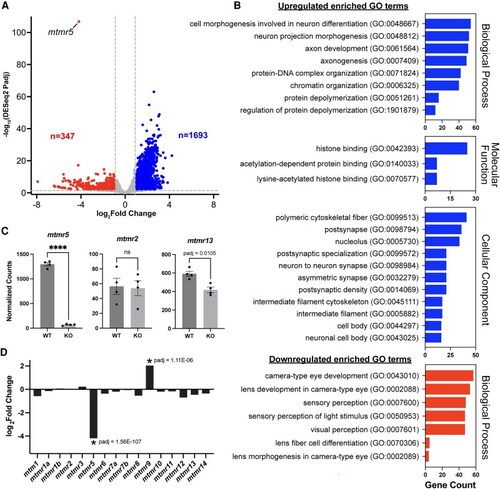
EXPRESSION / LABELING:
PHENOTYPE:
|
|