IMAGE

Figure 4

ID
ZDB-IMAGE-250311-31
Source
Figures for Lindzon et al., 2025
Image
Figure Caption

Figure 4

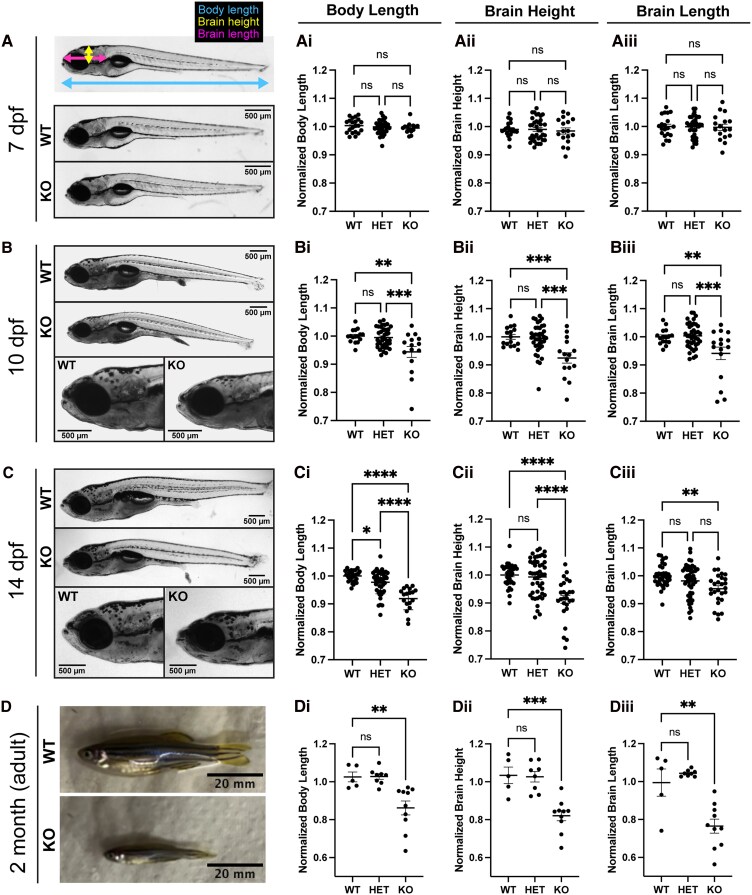
Loss of mtmr5 results in microcephaly and an overall body size reduction from as early as 10 dpf. (A, top) A representative image of a WT 7 dpf zebrafish with lines delineating the measured gross anatomy. This system is used to measure all age groups (7 dpf, 10 dpf, 14 dpf and 2 months). (A, middle and bottom) At 7 dpf, there was no observed difference in (Ai) body length, (Aii) brain height or (Aiii) brain length between the siblings and KO. WT n = 20, heterozygous (Het) = 36, and KO n = 17. (B) Microcephaly (i.e. reduced absolute brain size) starts to appear in the KO at 10 dpf, when (Bi) there was a significant reduction in body length, (Bii) brain height and (Biii) brain length in the KO. WT n = 16, Het n = 40, KO n = 16. (C and D) Similarly, at 14 dpf (C) and at 2 months (D), there was a significant decrease in body length (Ci and Di), brain height (Cii and Dii) and brain length (Ciii and Diii) in KO compared to WT siblings. 14 dpf: WT n = 27, Het n = 45, KO n = 18. 2 months: WT n = 5, Het n = 8, KO n = 10. All statistical analyses include at least three independent experiments. Each dot on the graphs represents one zebrafish, at least n = 5 zebrafish were used per group per experiment. Quantitative data are mean±SEM, normalized to the average of WT and presented as ratios. One-way ANOVA was done for all measurements. *P < 0.05; **P < 0.01; ****P < 0.0001; ns, not significant. Scale bars: 500 μm (7, 10 and 14 dpf images) or 20 mm (adult images).

Acknowledgments
This image is the copyrighted work of the attributed author or publisher, and ZFIN has permission only to display this image to its users. Additional permissions should be obtained from the applicable author or publisher of the image. Full text @ Brain Commun