IMAGE

Figure 5

ID
ZDB-IMAGE-250311-32
Source
Figures for Lindzon et al., 2025
Image
Figure Caption

Figure 5

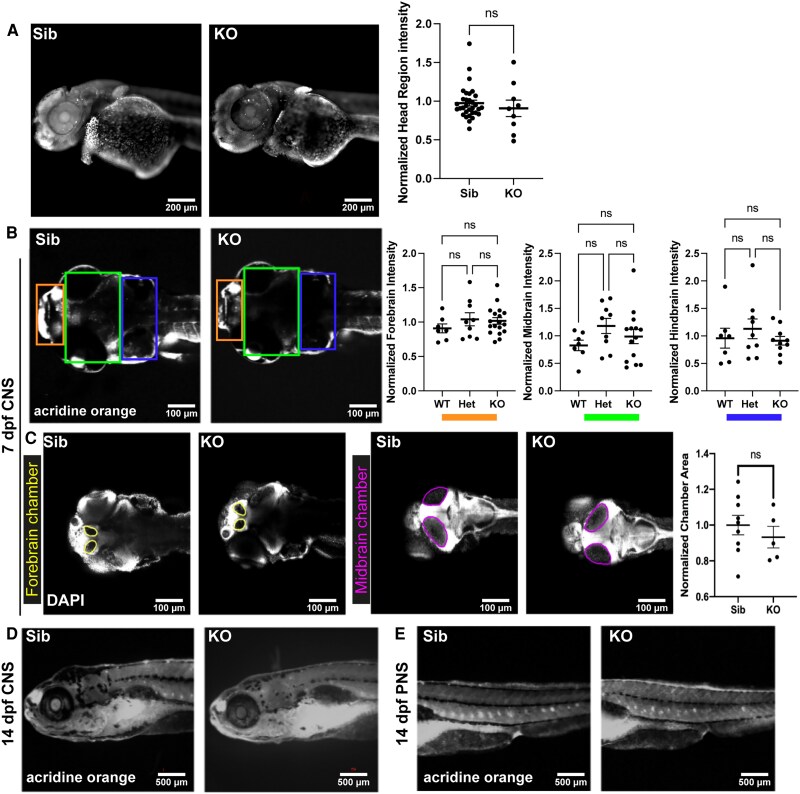
Loss of mtmr5 does not result in excessive cell death in the nervous system and does not cause changes in brain chamber size. (A and B) Representative average Z-projections depicting laterally orientated 2 days post-fertilization (dpf) (A) and 7 dpf (B) zebrafish embryos stained with acridine orange (AO) to visualize and quantify apoptotic cells in live zebrafish brains. No differences in AO intensity were detected between the sibling and the knockout (KO) (A—2 dpf: Sib n = 32, KO n = 9; B—7 dpf: WT n = 7, Het n = 9, KO n = 18). (C) Representative images from fixed and DAPI-stained 7 dpf zebrafish embryos to visualize and quantify brain chamber size. There were no qualitative or quantitative differences in both forebrain and midbrain size between the siblings and KOs at 7 dpf (Sib n = 9, KO n = 5). (D and E) Representative images of AO-stained (D) anterior lateral regions of 14 dpf zebrafish, encompassing the central nervous system, show no visual differences between the siblings and KOs, and (E) posterior-lateral regions of 14 dpf zebrafish, encompassing the peripheral nervous system, show no visual differences between the siblings and KOs. All statistical analyses include at least three independent experiments. Each dot on the graphs represents one zebrafish, at least n = 3 zebrafish were used per group per experiment. Quantitative data are mean±SEM, normalized to the average of WT and presented as ratios. Unpaired two-tailed Student’s t-test was used. ns, not significant. Scale bars: 200 μm (A), 100 μm (B and C) or 500 μm (D).

Acknowledgments
This image is the copyrighted work of the attributed author or publisher, and ZFIN has permission only to display this image to its users. Additional permissions should be obtained from the applicable author or publisher of the image. Full text @ Brain Commun