IMAGE

Figure 2

ID
ZDB-IMAGE-250311-29
Source
Figures for Lindzon et al., 2025
Image
Figure Caption

Figure 2

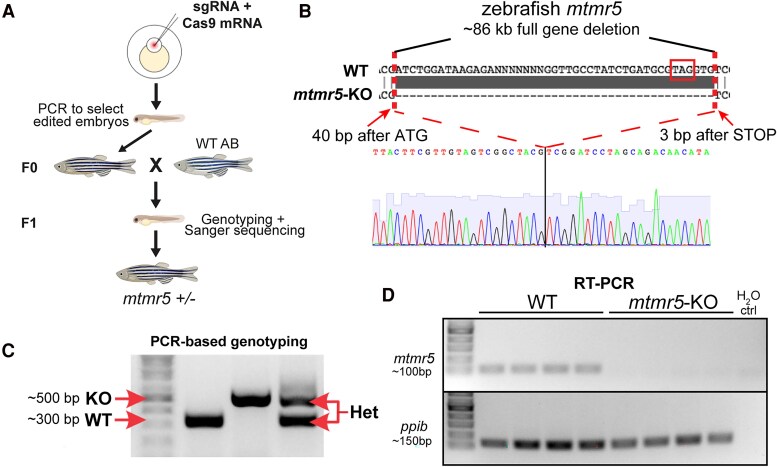
Generation of a full mtmr5 gene deletion/knockout zebrafish. (A) Schematic diagram of the workflow. Single-guide RNAs (sgRNA) and Cas9 (Clustered regularly interspaced short palindromic repeats or CRISPR associated protein 9) mRNA were co-injected into 1-cell stage zebrafish embryos (wild-type or WT; AB strain). The full mtmr5 gene deletion was first identified by PCR at F0 and further confirmed at F1 by PCR and Sanger sequencing. (B) Sanger sequencing revealed an 86 kilobase (kb) deletion at the mtmr5 gene, starting 40 base pairs (bp) after the translation start site to 3 bp after the translational stop site (STOP). (C) Genotyping was achieved using a 3-primer PCR method, showing the WT band at 300 bp (one flanking and one inside mtmr5), the mutant band at 500 bp (primers flanking mtmr5) and the heterozygous (Het) bands at both 300 and 500 bp. (D) Reverse transcription (RT)-PCR using specific primers against the deleted mtmr5 region shows a ∼100 bp band in the 7 dpf (days post-fertilization) WT cDNAs, and the lack of amplification in the mutant cDNAs. Housekeeping control (ppib) shows bands in both WT (wild-type) and mtmr5-knockout (KO) samples, and H2O (water) control shows no bands. Note: four biological replicates per condition, each lane represents n = 15–20 zebrafish heads (7 dpf). Uncropped gels of Fig. 2C and D are included in Supplementary Fig. 5B and C, respectively.

Acknowledgments
This image is the copyrighted work of the attributed author or publisher, and ZFIN has permission only to display this image to its users. Additional permissions should be obtained from the applicable author or publisher of the image. Full text @ Brain Commun