
- Title
-
ctdsp2 Knockout Induces Zebrafish Craniofacial Dysplasia via p53 Signaling Activation
- Authors
- Xia, X., Song, W., Zhang, F., Fan, Y., Zhang, B., Chen, X.
- Source
- Full text @ Int. J. Mol. Sci.
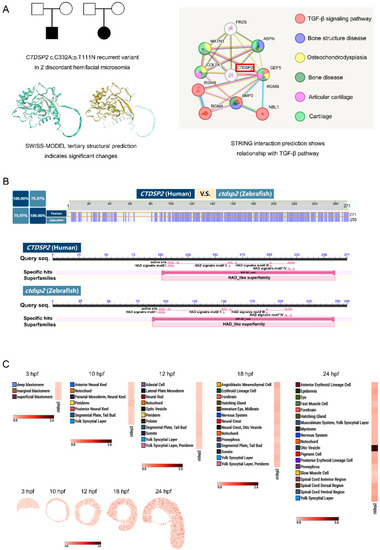
Identification of |
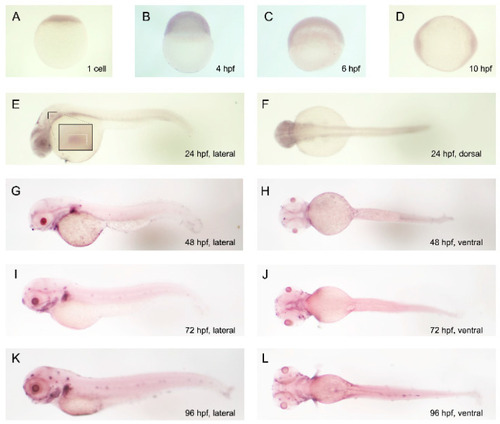
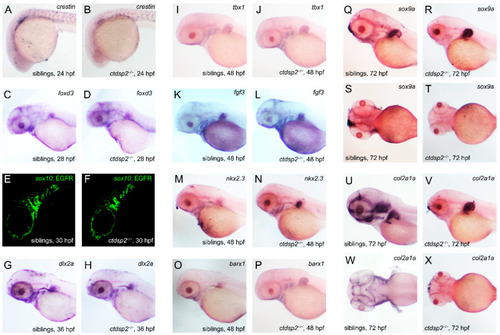
Temporal and spatial expression patterns of |
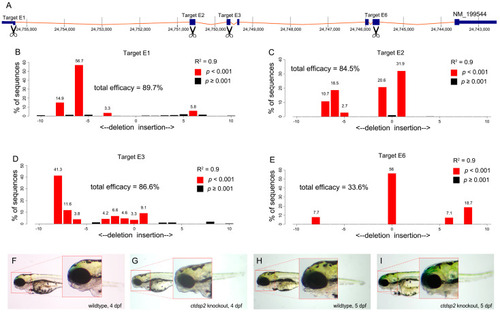
Knockout of |
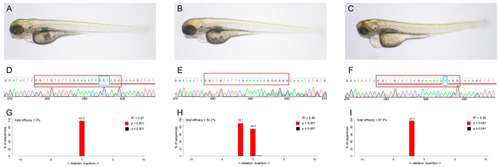
( |
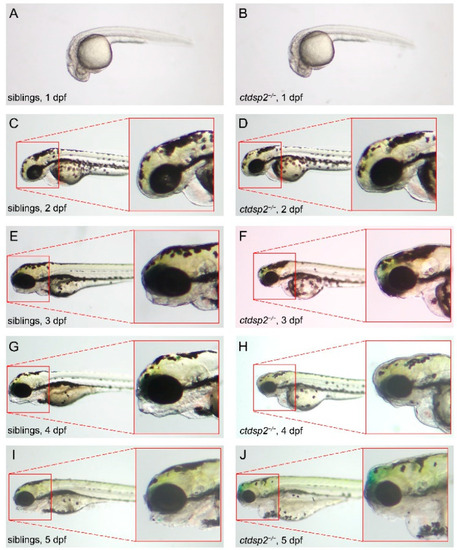
Phenotypic comparison between |
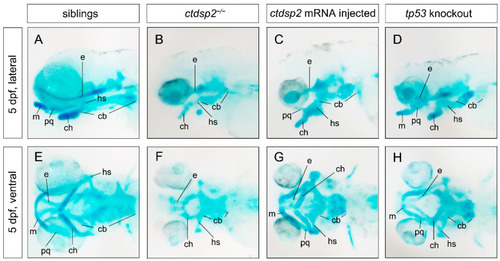
Staining results of pharyngeal arch cartilages using Alcian blue in various groups: ( |
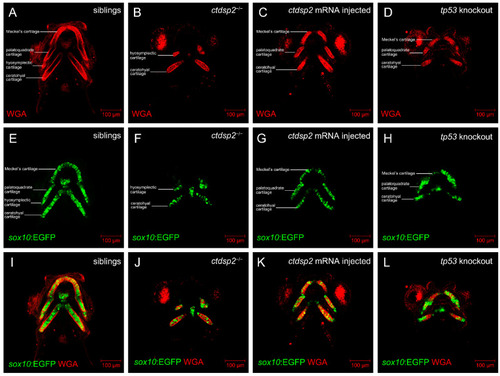
Comparative analysis of chondrocyte morphology in ( |
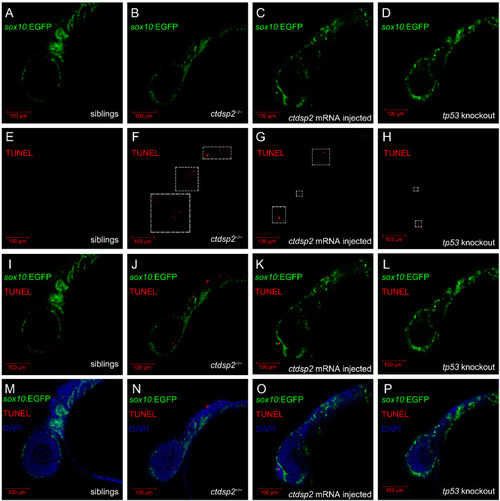
Analysis of somatic cell apoptosis in ( |
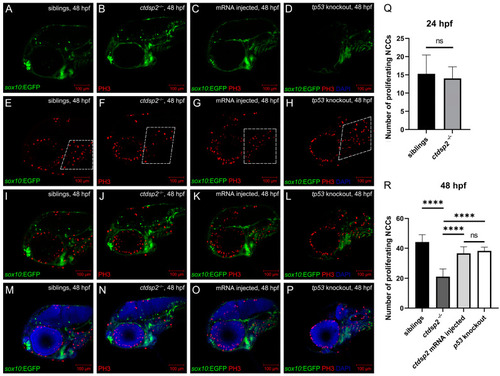
Immunofluorescence results depicting NCC proliferation through antiphosphohistone H3 (PH3) staining in ( |
The impact of |
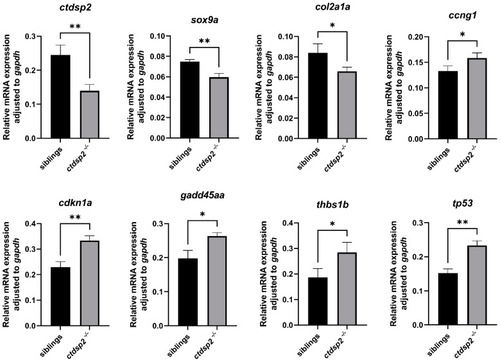
qPCR analysis of gene expression in |