FIGURE

Figure 4

ID
ZDB-FIG-250215-56
Publication
Xia et al., 2025 - ctdsp2 Knockout Induces Zebrafish Craniofacial Dysplasia via p53 Signaling Activation
Other Figures
All Figure Page
Back to All Figure Page
Figure 4

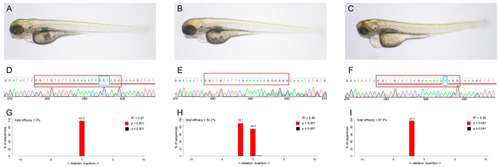
(AC) Phenotypes, (DF) Sanger sequencing chromatograms, and (GI) genotypes of F2 embryos. The F2 generation displayed two distinct phenotypic categories and three different genotypes: embryos without deformities had either wildtype or heterozygous ((−3+1) bp indels) genotypes, while those with deformities were exclusively homozygous for the (−3+1) bp indels. The red box denotes the sequence of gRNA (exon 1) (GGT TGT CTT CGA AAA CAG GT AGG), and the blue box indicates the 3 bp deletion sequence (GGT) and the 1 bp insert (A).

Expression Data

Expression Detail
Antibody Labeling
Phenotype Data

Phenotype Detail
Acknowledgments
This image is the copyrighted work of the attributed author or publisher, and ZFIN has permission only to display this image to its users. Additional permissions should be obtained from the applicable author or publisher of the image. Full text @ Int. J. Mol. Sci.