IMAGE

Figure 8

ID
ZDB-IMAGE-250215-60
Source
Figures for Xia et al., 2025
Image
Figure Caption

Figure 8

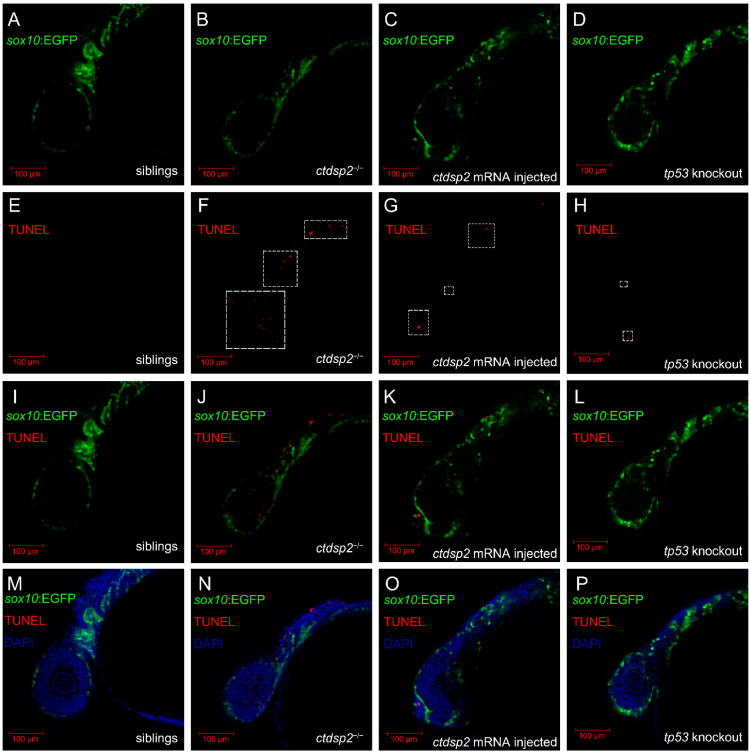
Analysis of somatic cell apoptosis in (A,E,I,M) control siblings, (B,F,J,N) ctdsp2−/− mutants, (C,G,K,O) ctdsp2−/− embryos injected with ctdsp2 mRNA, and (D,H,L,P) tp53-knockout ctdsp2−/− embryos at 24 h post-fertilization (hpf). TUNEL staining signals, indicative of apoptotic cells, were observed in the head, pharyngeal arch, and trunk in ctdsp2−/− mutants at 24 hpf. The signals were reduced after ctdsp2 mRNA injection. Control siblings and ctdsp2−/− embryos with tp53 knockout showed no apparent apoptotic signals. The dotted boxes highlight areas of TUNEL staining, emphasizing specific areas where apoptosis was detected.

Acknowledgments
This image is the copyrighted work of the attributed author or publisher, and ZFIN has permission only to display this image to its users. Additional permissions should be obtained from the applicable author or publisher of the image. Full text @ Int. J. Mol. Sci.