
- Title
-
Hypusinated and unhypusinated isoforms of the translation factor eIF5A exert distinct effects in models of pancreas development and function
- Authors
- Anderson, C.M., Kulkarni, A., Maier, B., Huang, F., Figatner, K., Chakraborty, A., Pratuangtham, S., May, S.C., Tersey, S.A., Anderson, R.M., Mirmira, R.G.
- Source
- Full text @ J. Biol. Chem.
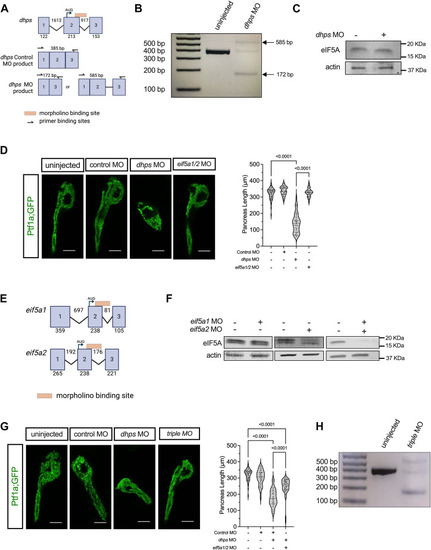
Effects of morpholinos (MOs) against dhps, eif5a1, and eif5a2 on pancreas length in zebrafish. A, model of the first three exons of dhps and the binding site of the dhps MO. PCR products amplified by primers between exon 1 (forward) and exon 3 (reverse) are shown: the normally spliced product and the disrupted-splicing products resulting from dhps MO. B, representative 2% agarose gel of RT–PCR products showing disrupted dhps transcript splicing with dhps MO in 24 h post fertilization (hpf) embryos. C, representative immunoblot analysis of total eIF5A protein levels in the absence or the presence of dhps MO at 3 days post fertilization (dpf). D, representative images and quantification of embryonic Ptf1a;GFP zebrafish pancreas length at 3 dpf following control, dhps, or eif5a1/2 MO injection. Control MO was injected at 8 ng/embryo. dhps MO was injected at 4 ng/embryo alongside 4 ng/embryo control MO. eif5a1 MO was injected at 4 ng/embryo alongside 4 ng/embryo eif5a2 MO. Scale bar represents 50 μm. Each point on the plot represents one embryo (N = 28–56 embryos). E, model of the first three exons and the binding site of the eif5a1 and eif5a2 MOs. F, representative immunoblots of total eIF5A protein in zebrafish embryos at 3 dpf following combinations of eif5a1 and eif5a2 MOs. Each MO was injected at 4 ng/embryo. G, representative images and quantification of embryonic Ptf1a;GFP zebrafish pancreas length at 3 dpf following control, dhps, or combined dhps and eif5a1/2 MO (triple MO) injection. Scale bar represents 50 microns. Each point on the plot represents one embryo (N = 28–51 embryos). Control MO was injected at 12 ng/embryo. dhps MO was injected at 4 ng/embryo alongside 8 ng/embryo control MO. dhps, eif5a1, and eif5a2 MOs were each injected at 4 ng/embryo together in triple MO embryos. H, representative 2% agarose gel of RT–PCR products showing disrupted dhps transcript splicing with triple MO in 24 hpf embryos. Data are presented as mean ± SEM, and statistical significance was determined by a one-way ANOVA with Tukey’s post hoc test. eIF5A, eukaryotic translation initiation factor 5A. EXPRESSION / LABELING:
PHENOTYPE:
|
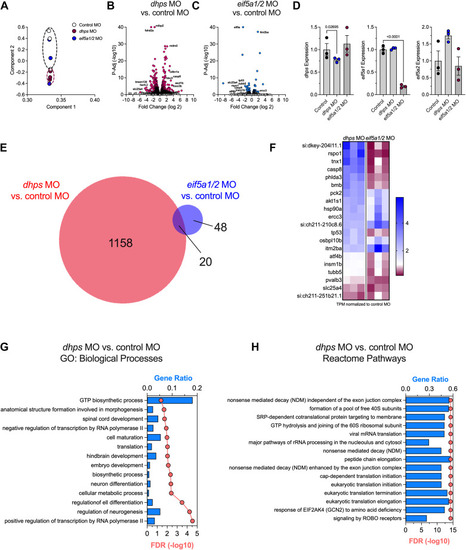
Transcriptional consequences of dhps morpholino (MO) and eif5a1/2 MO in zebrafish. RNA sequencing was performed on RNA isolated from zebrafish embryos. At 24 h post fertilization, control MO was injected at 8 ng/embryo, dhps MO was injected at 4 ng/embryo alongside 4 ng/embryo of control MO, and eif5a1 and eif5a2 MOs (eif5a1/2 MO) were coinjected at 4 ng/embryo each. N = 3 independent biological samples of 25 embryos each, and RNA was harvested at 3 days postfertilization. A, principal component analysis of altered gene expression with dhps or eif5a MO in zebrafish embryos. Black dashed circles represent control zebrafish, red dashed circles represent dhps MO zebrafish. B, volcano plot of altered genes in dhps MO embryos compared with control MO embryos; red circles indicate genes that satisfy the cutoff threshold of p-adj <0.05 and fold change> 2. C, volcano plot of altered genes in eif5a MO embryos compared with control MO embryos; blue circles indicate genes that satisfy the cutoff threshold of p-adj <0.05 and fold change >2. D, relative expression levels of dhps, eif5a1, and eif5a2 from the RNA sequencing data from the indicated MO datasets. E, Venn diagram of the overlap between genes altered by dhps MO versus control MO and genes altered by eif5a MO versus control MO. F, heat map showing the fold change of the 20 genes altered in both dhps MO versus control MO and eif5a MO versus control MO. G, Gene Ontology (GO) pathways altered by dhps MO versus control MO. H, Reactome pathways altered by dhps MO versus control MO. Data are presented as mean ± SEM, and statistical significance was determined by p-adj <0.05. eif5a, eukaryotic translation initiation factor 5A. EXPRESSION / LABELING:
PHENOTYPE:
|
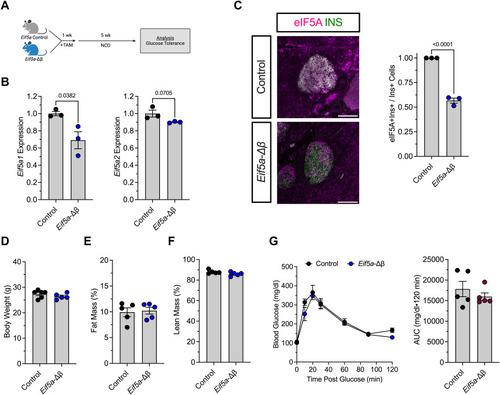
Metabolic phenotype following β-cell–specific deletion of Eif5a in adult mice. Eight-week-old male Eif5a-Δβ and control mice received intraperitoneal tamoxifen injections over 1 week and were allowed a week of recovery. Mice were fed a normal chow diet (NCD) for 5 weeks. N = 3 to 5 mice per group (each data point represents a different mouse). A, diagram showing the experimental design. B, quantitative RT–PCR for Eif5a1 and Eif5a2 transcripts from RNA from isolated islets. C, immunofluorescence and quantification of eIF5A (magenta) and insulin (green). Scale bar represents 100 μm. (D) Body weight. (E) Fat mass. (F) Lean mass. (G) Intraperitoneal glucose tolerance test (left panel) and area under the curve (right panel) of control and Eif5a-Δβ mice. Data are presented as mean ± SEM, and statistical significance was determined by an unpaired t test. eif5A, eukaryotic translation initiation factor 5A. |
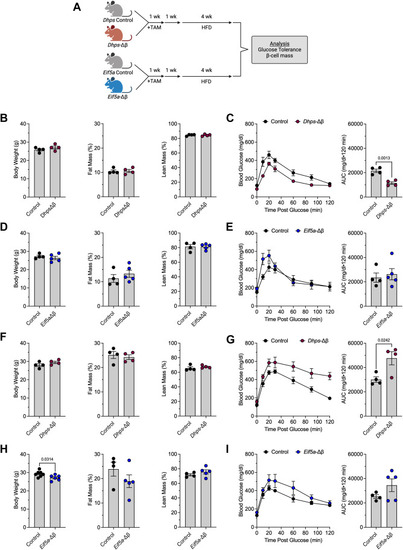
Effects of a high-fat diet (HFD) on metabolic parameters in adult Dhps-Δβ and Eif5a-Δβ mice. Eight-week-old male Eif5a-Δβ, Dhps-Δβ, and their respective littermate control mice received intraperitoneal tamoxifen injections over 1 week, allowed a week for recovery, and then placed on HFD (60% kcal from fat). N = 4 to 5 mice per group, and each point represents an individual mouse. A, diagram showing the experimental design of mouse studies. B, body weight, fat mass, and lean mass of Dhps-Δβ mice and control mice after 1 week of HFD. C, IPGTT and AUC of Dhps-Δβ mice and control mice after 1 week of HFD. D, body weight, fat mass, and lean mass of Eif5a-Δβ mice and control mice after 1 week of HFD. E, IPGTT and AUC representation of Eif5a-Δβ mice and control mice after 1 week of HFD. F, body weight, fat mass, and lean mass of Dhps-Δβ mice and control mice after 4 weeks of HFD. G, IPGTT and AUC of Dhps-Δβ mice and control mice after 4 weeks of HFD. H, body weight, fat mass, and lean mass of Eif5a-Δβ mice and Eif5a control mice after 4 weeks of HFD. I, IPGTT and AUC of Eif5a-Δβ mice and control mice after 4 weeks of HFD. Data are presented as mean ± SEM, and statistical significance was determined by an unpaired t test. AUC, area under the curve; IPGTT, intraperitoneal glucose tolerance test. |
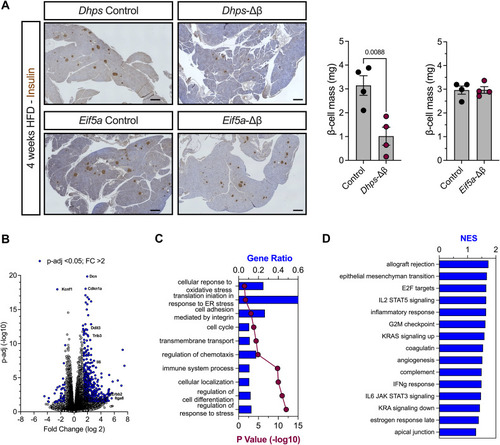
β-cell–specific Dhps and Eif5a1 deletions in adult mice on β-cell mass expansion in response to 4 weeks of HFD. N = 4 mice per group. A, representative images (left panels) immunostained for insulin and quantitation of β-cell mass (right bar graphs) in littermate control, Dhps-Δβ, and Eif5a-Δβ mouse pancreata after 4 weeks of HFD. Scale bar represents 100 μm. Each point represents one mouse. B, volcano plot showing genes with altered expression in Dhps-Δβ mouse islets compared with Dhps control mouse islets; blue circles indicate genes that satisfy the cutoff threshold of p-adj <0.05 and fold change >2. C, Gene Ontology (GO) pathways of Dhps-Δβ mouse islets compared with littermate control mouse islets. D, gene set enrichment analysis of Dhps-Δβ mouse islets compared with littermate control mouse islets. Data are presented as mean ± SEM, and statistical significance was determined by an unpaired t test. HFD, high-fat diet. |