FIGURE SUMMARY
Title

Low-input CUT&Tag for efficient epigenomic profiling of zebrafish stage I oocytes

Authors
Zheng, Q., Wu, X., Li, X., Mo, X., Xiang, B., Chen, J.
Source
Full text @ Front Cell Dev Biol

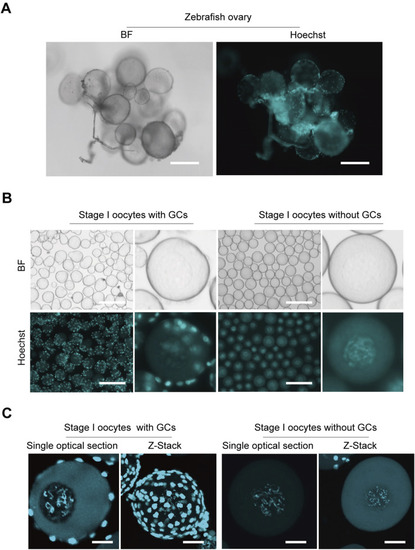
Isolation zebrafish stage I oocytes without granulosa cells. (A) Morphological imaging of zebrafish ovaries. (B) Isolated stage I oocytes with or without granulosa cells. (C) Z-Stack and single optical section images of oocytes with or without granulosa cells captured by confocal microscopy. BF, bright field; GCs, granulosa cells. Z-Stack, Z-axis projection by stacking; Scale bar: 100 μm (A), 200 μm (B), 20 μm (C).

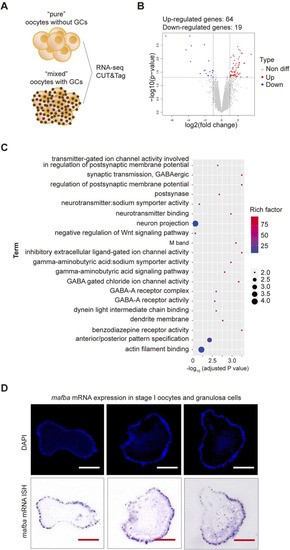
RNA sequencing analysis of differentially expressed genes (DEGs) between stage I oocytes with or without granulosa cells. (A) Schematic diagram of sequencing analysis. (B) Volcano plot of DEGs. “pure” sample versus “mixed” sample, upregulated and downregulated genes are indicated in red and blue, respectively. DEGs were identified based on the following criteria: p-value < 0.05 and log2|fold change| ≥ 1. (C) Gene Ontology (GO) enrichment analysis of differentially upregulated genes between stage I oocytes with or without granulosa cells. GO enrichment analysis was based on the following criteria: adjusted p-value < 0.05. (D)In situ hybridization (ISH) of mafba and DAPI staining of zebrafish ovary sections. Purple: RNA probe labeled mafba mRNA; Blue: DAPI labeled cell nuclei. Scale bar, 100 μm.

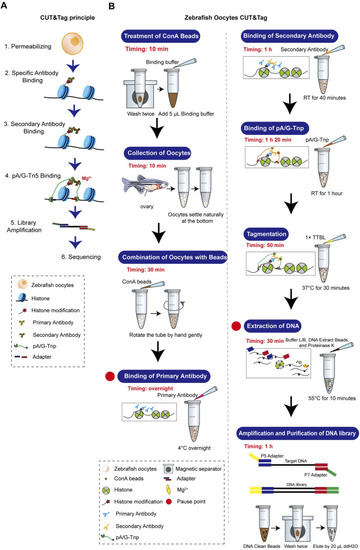
Zebrafish oocyte CUT&Tag principle and workflow. (A) Schematic diagram of CUT&Tag. (B) Zebrafish oocyte CUT&Tag workflow.

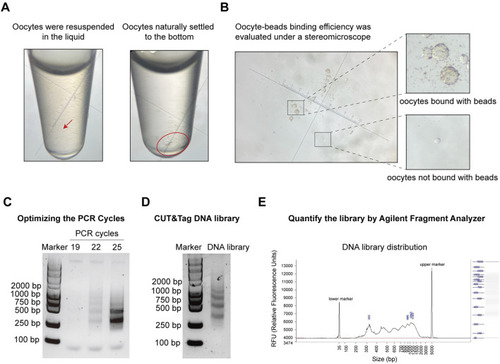
Pre-sequencing quality control of oocyte CUT&Tag. (A) Images of oocyte collection in a tube under a stereomicroscope. Left panel: oocytes resuspended in liquid; Right panel: oocytes settled at the bottom by gravity. Magnification = 45x. (B) Images of ConA beads-oocyte complex and unbound oocytes under a stereomicroscope. Magnification = 45x. (C) Agarose gel electrophoresis images for PCR cycles test with different PCR cycles. (D) Agarose gel electrophoresis images of the final CUT&Tag library. (E) Electrophoresis of the final DNA library and the distribution analysis using the DNF-915 Fragment Analyzer.

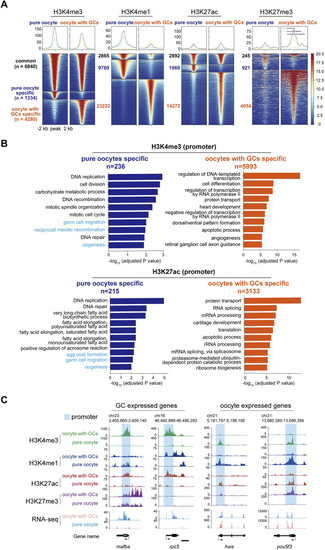
CUT&Tag analysis of histone modifications between stage I oocytes with or without granulosa cells. (A) Heatmap showing the H3K4me3, H3K4me1, H3K27ac, and H3K27me3 enrichment around peak center (peak center ±2 kb) in pure oocytes and oocytes with GCs samples. Peaks were classified into three clusters based on their dynamics between samples: common (present in both samples), pure oocyte-specific (only present in pure oocytes sample), and oocyte with GCs-specific (only present in the mixed sample). The numbers of peaks in each group were labeled. (B) Barplots showing the top 10 GO terms enriched for genes whose TSS were located within ±2 kb of H3K4me3 (upper) or H3K27ac (lower) peaks specific in pure oocytes (left, blue) or mixed samples (right, orange). Oogeneisis and germ cell related terms were highlighted in light blue. (C) H3K4me3, H3K4me1, H3K27ac, and H3K27me3 modifications near differentially GC expressed genes (mafba and rpz5) and oocyte expressed maternal genes (hwa and pou5fa) in stage I oocytes with or without granulosa cells. Promoter of each gene was labeled in light blue. GCs, granulosa cells.

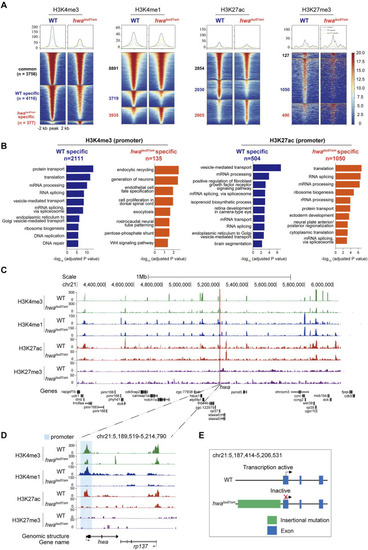
Distinct histone modifications around hwa locus between WT and hwatsu01sm mutants. (A) Heatmap showing the H3K4me3, H3K4me1, H3K27ac, and H3K27me3 enrichment around peak center (peak center ±2 kb) in WT and hwatsu01sm mutant pure oocytes. Peaks were classified into three clusters based on their dynamics between two samples: common (present in both WT and mutant samples), WT-specific (only present in WT oocytes), and hwa-specific (only present in mutant oocytes). The numbers of peaks in each group were also labeled. (B) Barplots showing the top 10 GO terms enriched for genes whose TSS were located within ±2 kb of H3K4me3 (left) or H3K27ac (right) peaks specific in WT oocytes (blue) or mutant oocytes (orange). (C) H3K4me3, H3K4me1, H3K27ac and H3K27me3 modifications landscapes at a region including 1 Mb upstream and downstream of hwa locus in the WT and hwatsu01sm oocytes. (D) H3K4me3, H3K4me1, H3K27ac, and H3K27me3 modifications at the hwa locus in the WT and hwatsu01sm oocytes. (E) Schematic diagram of gene structure and expression activity of WT and hwatsu01sm mutant. WT, wild type; hwatsu01sm, hwa expression-deficient mutant with a retrotransposon insertion.

Acknowledgments
This image is the copyrighted work of the attributed author or publisher, and ZFIN has permission only to display this image to its users. Additional permissions should be obtained from the applicable author or publisher of the image. Full text @ Front Cell Dev Biol