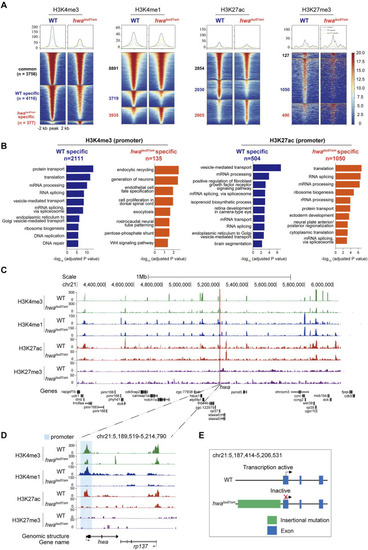
Distinct histone modifications around hwa locus between WT and hwatsu01sm mutants. (A) Heatmap showing the H3K4me3, H3K4me1, H3K27ac, and H3K27me3 enrichment around peak center (peak center ±2 kb) in WT and hwatsu01sm mutant pure oocytes. Peaks were classified into three clusters based on their dynamics between two samples: common (present in both WT and mutant samples), WT-specific (only present in WT oocytes), and hwa-specific (only present in mutant oocytes). The numbers of peaks in each group were also labeled. (B) Barplots showing the top 10 GO terms enriched for genes whose TSS were located within ±2 kb of H3K4me3 (left) or H3K27ac (right) peaks specific in WT oocytes (blue) or mutant oocytes (orange). (C) H3K4me3, H3K4me1, H3K27ac and H3K27me3 modifications landscapes at a region including 1 Mb upstream and downstream of hwa locus in the WT and hwatsu01sm oocytes. (D) H3K4me3, H3K4me1, H3K27ac, and H3K27me3 modifications at the hwa locus in the WT and hwatsu01sm oocytes. (E) Schematic diagram of gene structure and expression activity of WT and hwatsu01sm mutant. WT, wild type; hwatsu01sm, hwa expression-deficient mutant with a retrotransposon insertion.
|
