FIGURE

FIGURE 5

ID
ZDB-FIG-241219-97
Publication
Zheng et al., 2024 - Low-input CUT&Tag for efficient epigenomic profiling of zebrafish stage I oocytes
Other Figures
All Figure Page
Back to All Figure Page
FIGURE 5

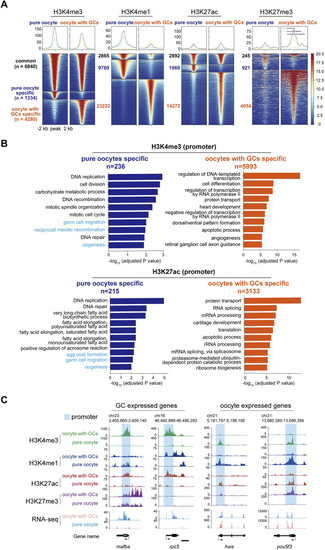
CUT&Tag analysis of histone modifications between stage I oocytes with or without granulosa cells. (A) Heatmap showing the H3K4me3, H3K4me1, H3K27ac, and H3K27me3 enrichment around peak center (peak center ±2 kb) in pure oocytes and oocytes with GCs samples. Peaks were classified into three clusters based on their dynamics between samples: common (present in both samples), pure oocyte-specific (only present in pure oocytes sample), and oocyte with GCs-specific (only present in the mixed sample). The numbers of peaks in each group were labeled. (B) Barplots showing the top 10 GO terms enriched for genes whose TSS were located within ±2 kb of H3K4me3 (upper) or H3K27ac (lower) peaks specific in pure oocytes (left, blue) or mixed samples (right, orange). Oogeneisis and germ cell related terms were highlighted in light blue. (C) H3K4me3, H3K4me1, H3K27ac, and H3K27me3 modifications near differentially GC expressed genes (mafba and rpz5) and oocyte expressed maternal genes (hwa and pou5fa) in stage I oocytes with or without granulosa cells. Promoter of each gene was labeled in light blue. GCs, granulosa cells.

Expression Data

Expression Detail
Antibody Labeling
Phenotype Data

Phenotype Detail
Acknowledgments
This image is the copyrighted work of the attributed author or publisher, and ZFIN has permission only to display this image to its users. Additional permissions should be obtained from the applicable author or publisher of the image. Full text @ Front Cell Dev Biol